I have referenced the handy JDK tool jcmd in several posts in the past, but focus exclusively on its usefulness here like I have previously done for jps. The jcmd tool was introduced with Oracle’s Java 7 and is particularly useful in troubleshooting issues with JVM applications by using it to identify Java processes’ IDs (akin to jps), acquiring heap dumps (akin to jmap), acquiring thread dumps (akin to jstack), viewing virtual machine characteristics such as system properties and command-line flags (akin to jinfo), and acquiring garbage collection statistics (akin to jstat). The jcmd tool has been called “a swiss-army knife for investigating and resolving issues with your JVM application” and a “hidden gem.”
When using most JDK command-line tools (including jcmd), it’s often important to identify the process ID (pid) of the Java process for which we want to use the command-line tool. This is easily accomplished with jcmd by simply running the command without any arguments as shown in the next screen snapshot.
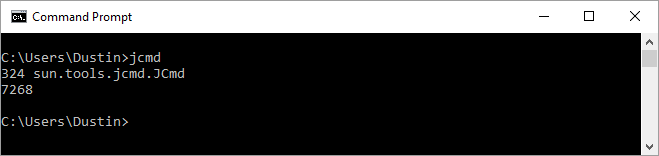
Running jcmd without arguments in the example above shows two Java processes running (jcmd itself with a pid of 324 and another Java process with a pid of 7268). Note that although jcmd works very much like jps when it comes to listing Java processes, jcmd lists more information than jps does without arguments -lm.
Running jcmd -h shows help and usage information for jcmd as demonstrated in the next screen snapshot.
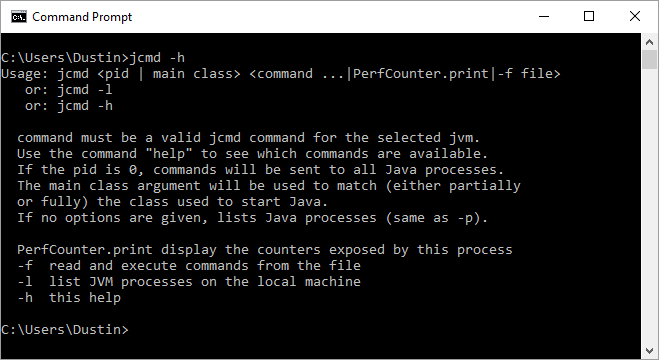
The help explains, as was just shown, that jcmd “lists Java processes” when “no options are given.” The help also states that this is behavior similar to running jcmd -p, but I think it means to say running jcmd without options is equivalent to running jcmd -l, which is shown in the next screen snapshot.

As when jcmd was run without any options, jcmd -l lists Java processes and their respective pids. The pids are different in this example because it’s a different execution of jcmd and I have a different Java process running this time.
Running jcmd -h showed relatively few options. To see help on the many capabilities that jcmd supports, one needs to ask jcmd which capabilities are supported for a particular Java process. The next screen snapshot illustrates this. I first run jcmd without options to discover the pid of the Java process of interest (6320 in this case). Then, I am able to run jcmd 6320 help to see which commands jcmd supports.
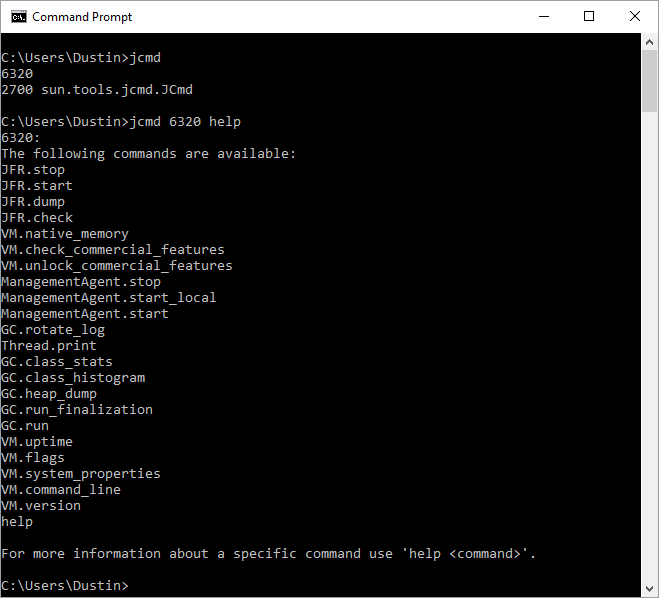
The previous screen snapshot demonstrates the commands jcmd supports for the particular Java VM identified by the pid. Specifically, it states, “The following commands are available:” and then lists them:
- JFR.stop
- JFR.start
- JFR.dump
- JFR.check
- VM.native_memory
- VM.check_commercial_features
- VM.unlock_commercial_features
- ManagementAgent.stop
- ManagementAgent.start_local
- ManagementAgent.start
- GC.rotate_log
- GC.class_stats
- GC.class_histogram
- GC.heap_dump
- GC.run_finalization
- GC.run
- Thread.print
- VM.uptime
- VM.flags
- VM.system_properties
- VM.command_line
- VM.version
- help
When jcmd <pid> help is run against a pid for a different Java VM process, it’s possible to get a different list of available commands. This is illustrated in the next screen snapshot when jcmd 1216 help is executed against that process with pid of 1216.
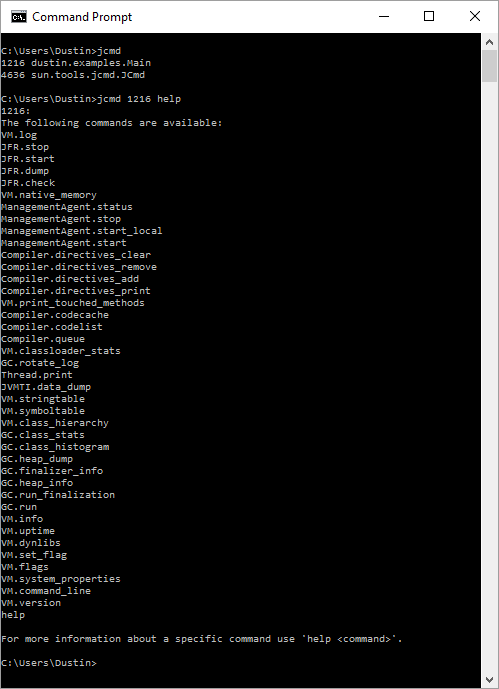
By comparing the last two screen snapshots, it becomes clear that jcmd supports different commands for different Java VM instances. This is why the supported commands for a particular VM are listed by specifying the pid in the help command. Some of the commands available against the second VM (pid 1216 in this case) that were not listed for the originally checked VM include the following:
- VM.log
- ManagementAgent.status
- Compiler.directives_clear
- Compiler.directives_remove
- Compiler.directives_add
- Compiler.directives_print
- VM.print_touched_methods
- Compiler.codecache
- Compiler.codelist
- Compiler.queue
- VM.classloader_stats
- JVMTI.data_dump
- VM.stringtable
- VM.symboltable
- VM.class_hierarchy
- GC.finalizer_info
- GC.heap_info
- VM.info
- VM.dynlibs
- VM.set_flag
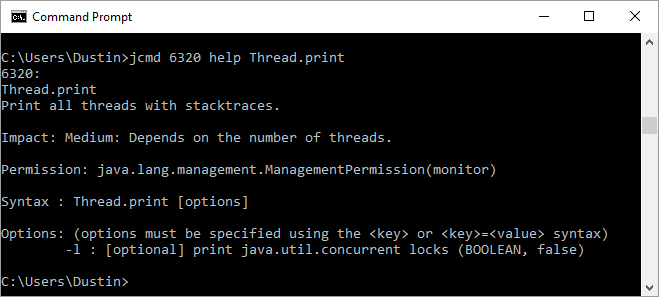
This “help” also advises, “For more information about a specific command use ‘help <command>’.” Doing this is illustrated in the next screen snapshot specifically for jcmd‘s Thread.print
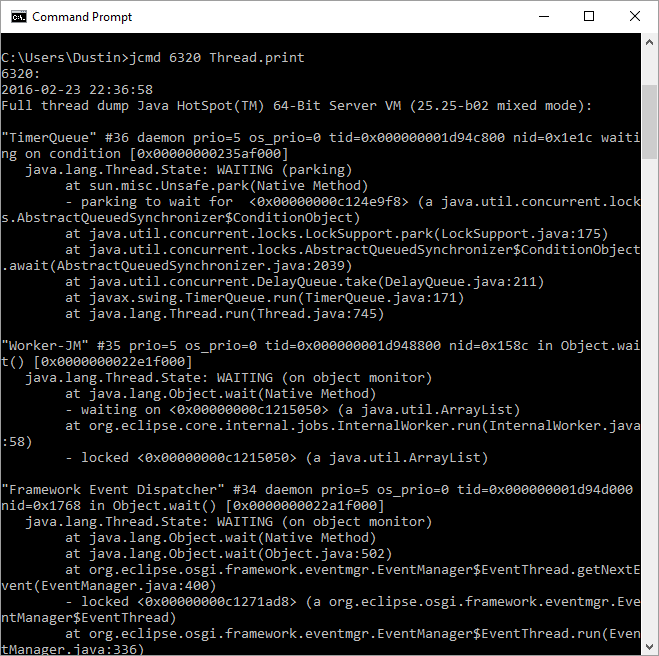
While on the subject of jcmd Thread.print command, it’s a good time to illustrate using this to see thread stacks of Java processes. The next screen snapshot shows the beginning of the much lengthier results seen when jcmd <pid> Thread.print is executed (in this case for the Java process with pid 6320).
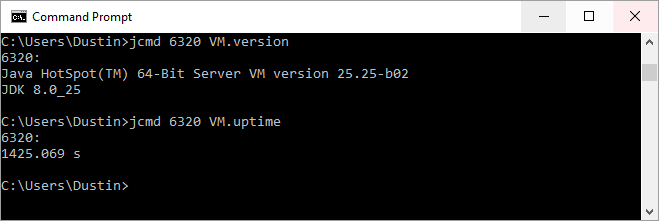
There are several VM.* commands supported by jcmd: VM.version, VM.uptime, VM.command_line, VM.flags, VM.system_properties, VM.native_memory, and VM.classloader_stats. The next screen snapshot illustrates use of jcmd <pid> VM.version and jcmd <pid> VM.uptime for the Java process with pid 6320.
The next screen snapshot demonstrates execution of jcmd <pid> VM.command_line against process with pid 6320.
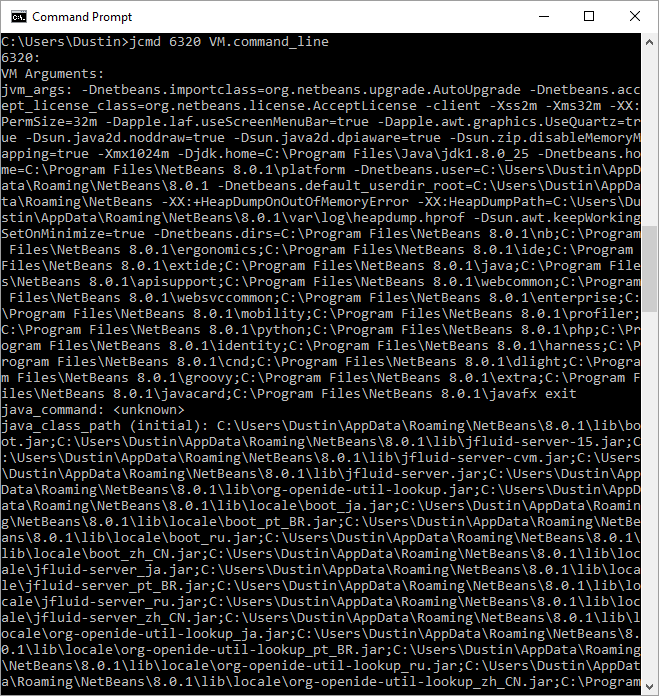
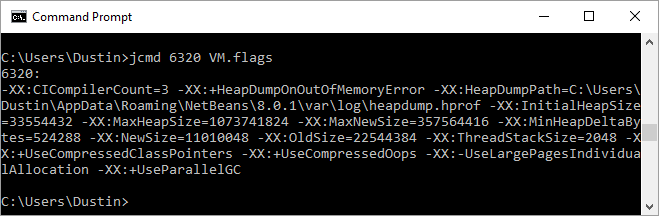
From this screen snapshot which shows the top portion of the output from running jcmd 6320 VM.command_line, we can see from the JVM command-line arguments that were provided to this process that it’s a NetBeans-related process. Running the command jcmd <pid> VM.flags against Java process with pid 6320 shows the HotSpot options passed to that process.
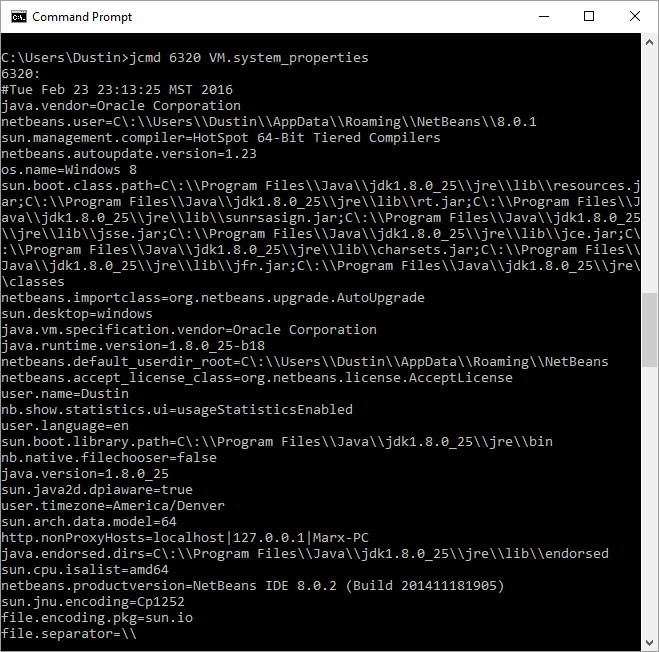
The system properties used by a Java process can be listed using jcmd <pid> VM.system_properties and this is illustrated in the next screen snapshot.
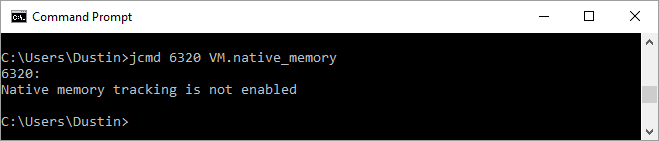
When one attempts to run jcmd <pid> VM.native_memory against a Java process that hasn’t had Native Memory Tracking (NMT) enabled, the error message “Native Memory Tracking is not enabled” is printed as shown in the next screen snapshot.
To use the command jcmd <pid> VM.native_memory, the JVM (java process) to be measured should be started with either the -XX:NativeMemoryTracking=summary or -XX:NativeMemoryTracking=detail options. Once the VM has been started with either of those options, the commands jcmd <pid> VM.native_memory baseline and then jcmd <pid> VM.native_memory detail.diff can be executed against that JVM process.
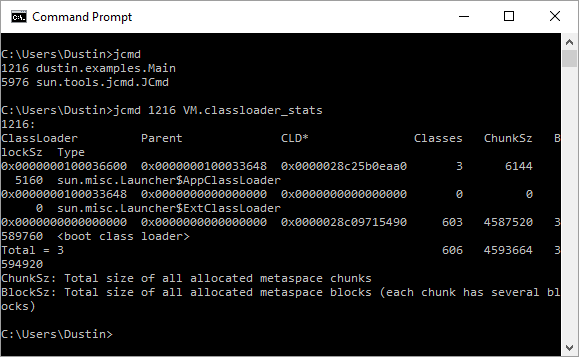
The command jcmd <pid> VM.classloader_stats provides insight into the classloader. This is shown in the next screen snapshot against Java process with pid 1216:
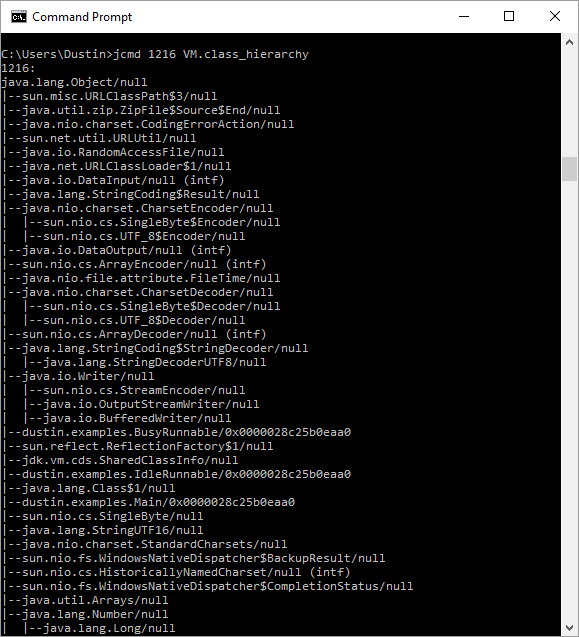
jcmd <pid> VM.class_hierarchy is an interesting command that prints the hierarchy of the classes loaded in the targeted Java VM process.
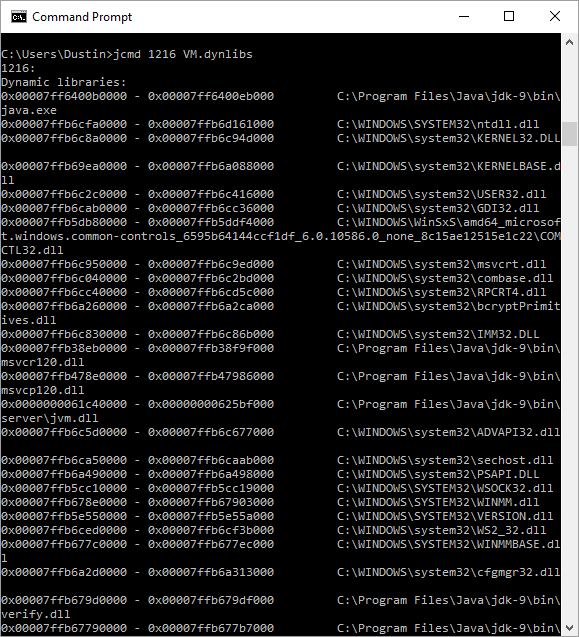
jcmd <pid> VM.dynlibs can be used to view dynamic libraries information. This is demonstrated in the next screen snapshot when executed against Java process with pid 1216.
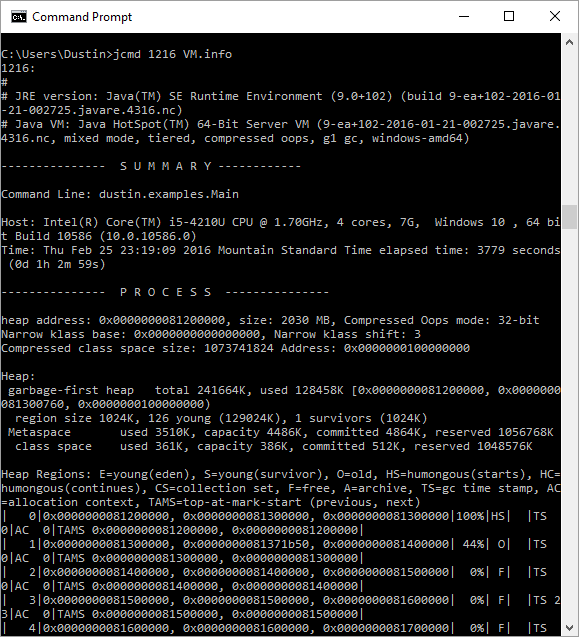
The jcmd <pid> VM.info lists a lot of information regarding the targeted Java VM process including a VM summary and information about the process, garbage collection events, dynamic libraries, arguments provided to the VM, and some of the characteristics of the host machine. Just a small part of the beginning of the output of this is demonstrated in the next screen snapshot for jcmd 1216 VM.info:
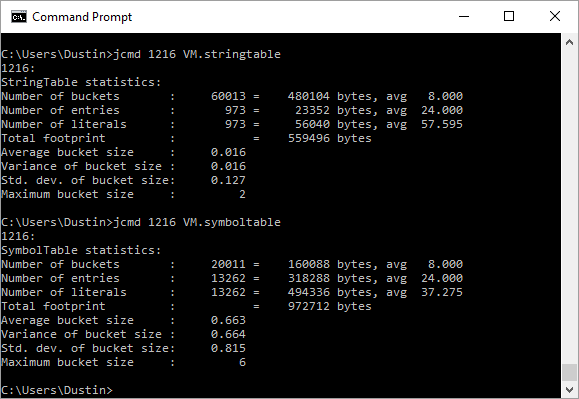
The next screen snapshot demonstrates use of jcmd <pid> VM.stringtable and jcmd <pid> VM.symboltable:
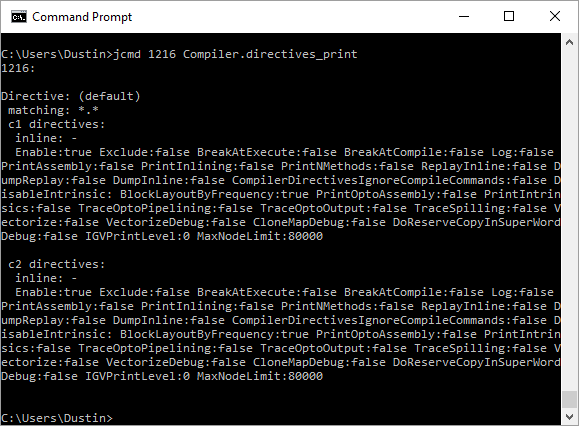
Use of jcmd <pid> Compiler.directives_print is demonstrated in the next screen snapshot.
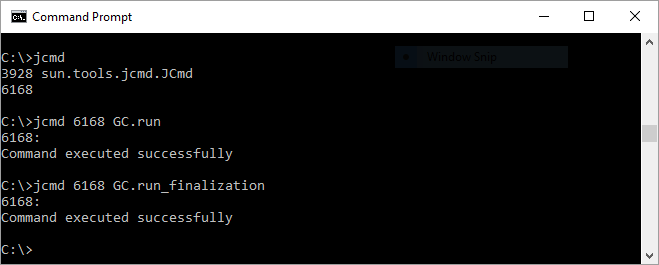
Several commands supported by jcmd support managing and monitoring garbage collection. Two of these are jcmd <pid> GC.run [similar to System.gc()] and jcmd <pid> GC.run_finalization [similar to System.runFinalization()]. The two of these are demonstrated in the next screen snapshot.
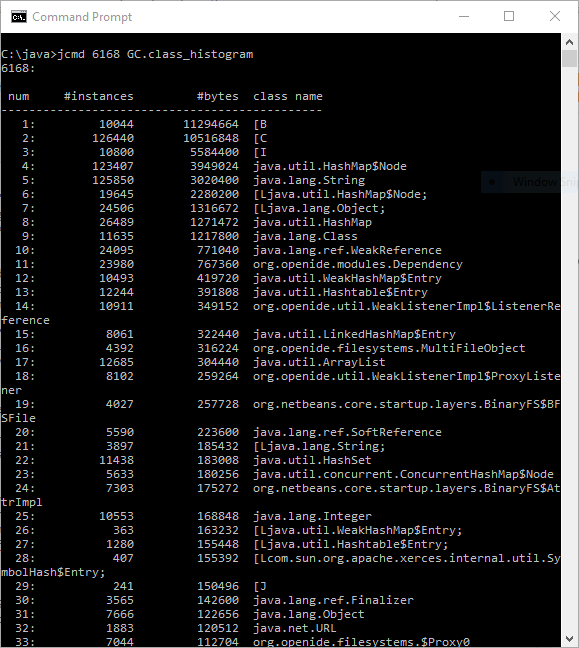
The command jcmd <pid> GC.class_histogram provides a handy way to view an object histogram as shown in the next screen snapshot.
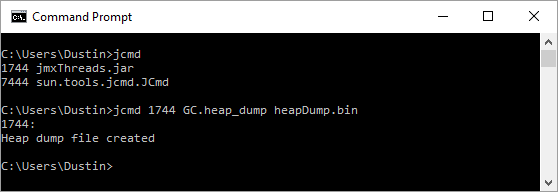
jcmd can be used to generate a heap dump against a running Java VM with jcmd <pid> GC.heap_dump <filename> and this is demonstrated in the next screen snapshot.
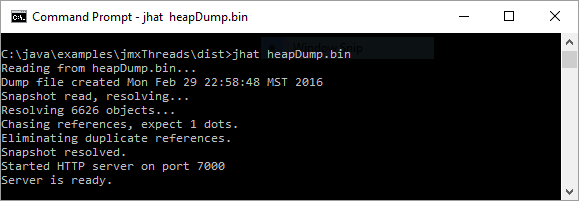
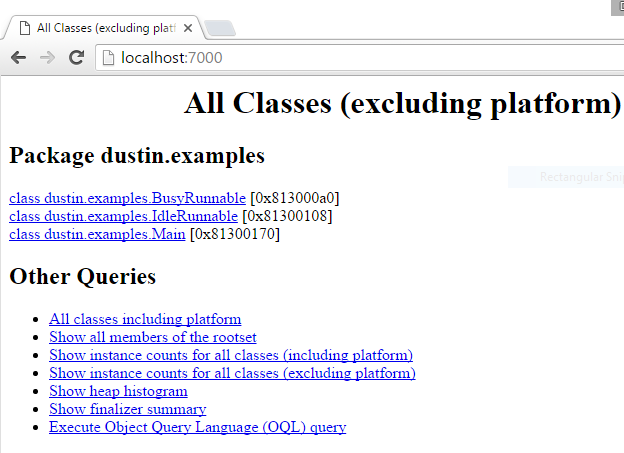
The jhat command can now be used to process the heap dump generated by jcmd as shown in the next two screen snapshots.
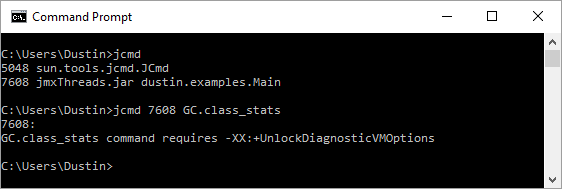
There are some jcmd commands that only work against Java VMs that were started using the -XX:+UnlockDiagnosticVMOptions JVM flag. The next screen snapshot demonstrates what happens when I try to run jcmd <pid> GC.class_stats against a Java VM that wasn’t started with the flag -XX:+UnlockDiagnosticVMOptions.
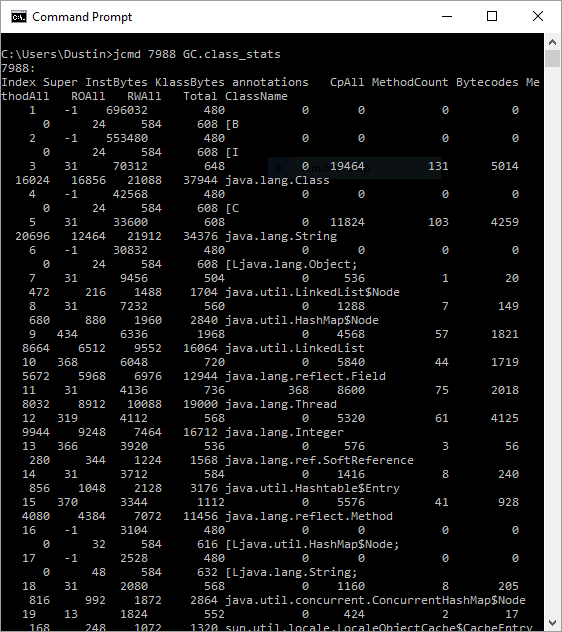
When the targeted VM is started with -XX:+UnlockDiagnosticVMOptions, jcmd <pid> GC.class_stats displays “statistics about Java class metadata.”
This post has covered several of the commands provided by jcmd, but has not covered the functionality related to Java Flight Recorder [JFR] (commands with names starting with JFR.*), to checking and enabling commercial features (jcmd <pid> VM.check_commercial_features and jcmd <pid> VM.unlock_commercial_features).
In one command-line tool, jcmd brings together the functionality of several command-line JDK tools. This post has demonstrated several of the functions provided by jcmd.
| Reference: | jcmd: One JDK Command-Line Tool to Rule Them All from our JCG partner Dustin Marx at the Inspired by Actual Events blog. |

Thanks for great article. These seems like an awesome tool!
What can you do when jcmd returns:
com.sun.tools.attach.AttachNotSupportedException: Unable to open socket file: target process not responding or HotSpot VM not loaded
at sun.tools.attach.LinuxVirtualMachine.(LinuxVirtualMachine.java:106)
at sun.tools.attach.LinuxAttachProvider.attachVirtualMachine(LinuxAttachProvider.java:63)
at com.sun.tools.attach.VirtualMachine.attach(VirtualMachine.java:208)
at sun.tools.jcmd.JCmd.executeCommandForPid(JCmd.java:147)
at sun.tools.jcmd.JCmd.main(JCmd.java:131)
There does not appear to be a -F option.
I don’t recall seeing that personally, but a few things I’d try to get around it are: 1) Ensure that the same user running the JVM process you want to connect to is running jcmd (similar rules to jps for using the Attach API). 2) Ensure that the JVM process is running on a version of Java that jcmd expects to support. I don’t know what the minimum version of JRE supported by jcmd is, but I always use jcmd from the same version JDK as the JVM that I’m trying to monitor. It would not surprise me if jcmd… Read more »