Abstract
This tutorial gives an example of how to use Hewlett Packard Enterprise’s AppPulse Mobile to monitor your application’s performance. We will walk through how AppPulse Mobile can help you detect performance issues in your application easily.
I am using a Mac OS X 10.10.5 with a Nexus 5 (Marshmallow 6.0) for development. The IDE used for development and testing is Android Studio. Although the examples used in this tutorial are Android-specific, the same concepts apply to iOS as well.
- All code used for this project can be found at https://github.com/seethaa/HPEAppPulseMobile.git.
Why is UI Performance So Important?
Did you know that 55% of users consider their mobile apps to be accountable for slow performance, and not their network or device? As the number of apps in the mobile ecosystem grows daily, users are becoming more and more intolerant to slow performance of mobile apps. Developers are becoming aware that user experience is extremely important in order to keep a user coming back to the app. In the past, developers needed to write tests in code to see how long it takes for each user action to perform. These were inefficient and inaccurate at times. Companies now have millions of users on hundreds of unique devices, and there is no simple way to assess performance. Fortunately, AppPulse Mobile enables you to deliver great customer experience by providing actionable information on user interactions, and identifying the problems that affect most users.
Automatic User Action Performance Monitoring
As a developer, it is important to understand the core of the problem when something breaks. By being aware of errors and fixing them before many users encounter the same bad user experience, we can build credibility and gain trust from our users.
For each user interaction, AppPulse Mobile automatically captures performance by tracking the action and its average response time, by measuring the time between a button click and the UI rendering. The screen name and actions are tracked by AppPulse Mobile so that any name changes in code are automatically reflected.

Using the AppPulse Mobile HTTP Timeline, developers can view details on a specific user-action hit, and all methods that were executed (similar to diagnostics/call-trace). All UI updates related to the user action are tracked, and the time between the action start and the last UI update is the measured UI performance.
Correlation of UI updates to actions is done by tracking all of the UI thread and async operations that were triggered by the action and resulted with UI updates.
In order to see how to monitor performance using AppPulse Mobile, we will walk through a simple Android app.
How to Get Started with AppPulse Mobile, by Dirk de Kok
Setting Up
Register for a trial or full version of AppPulse Mobile at https://saas.hpe.com/try/AppPulse-mobile.
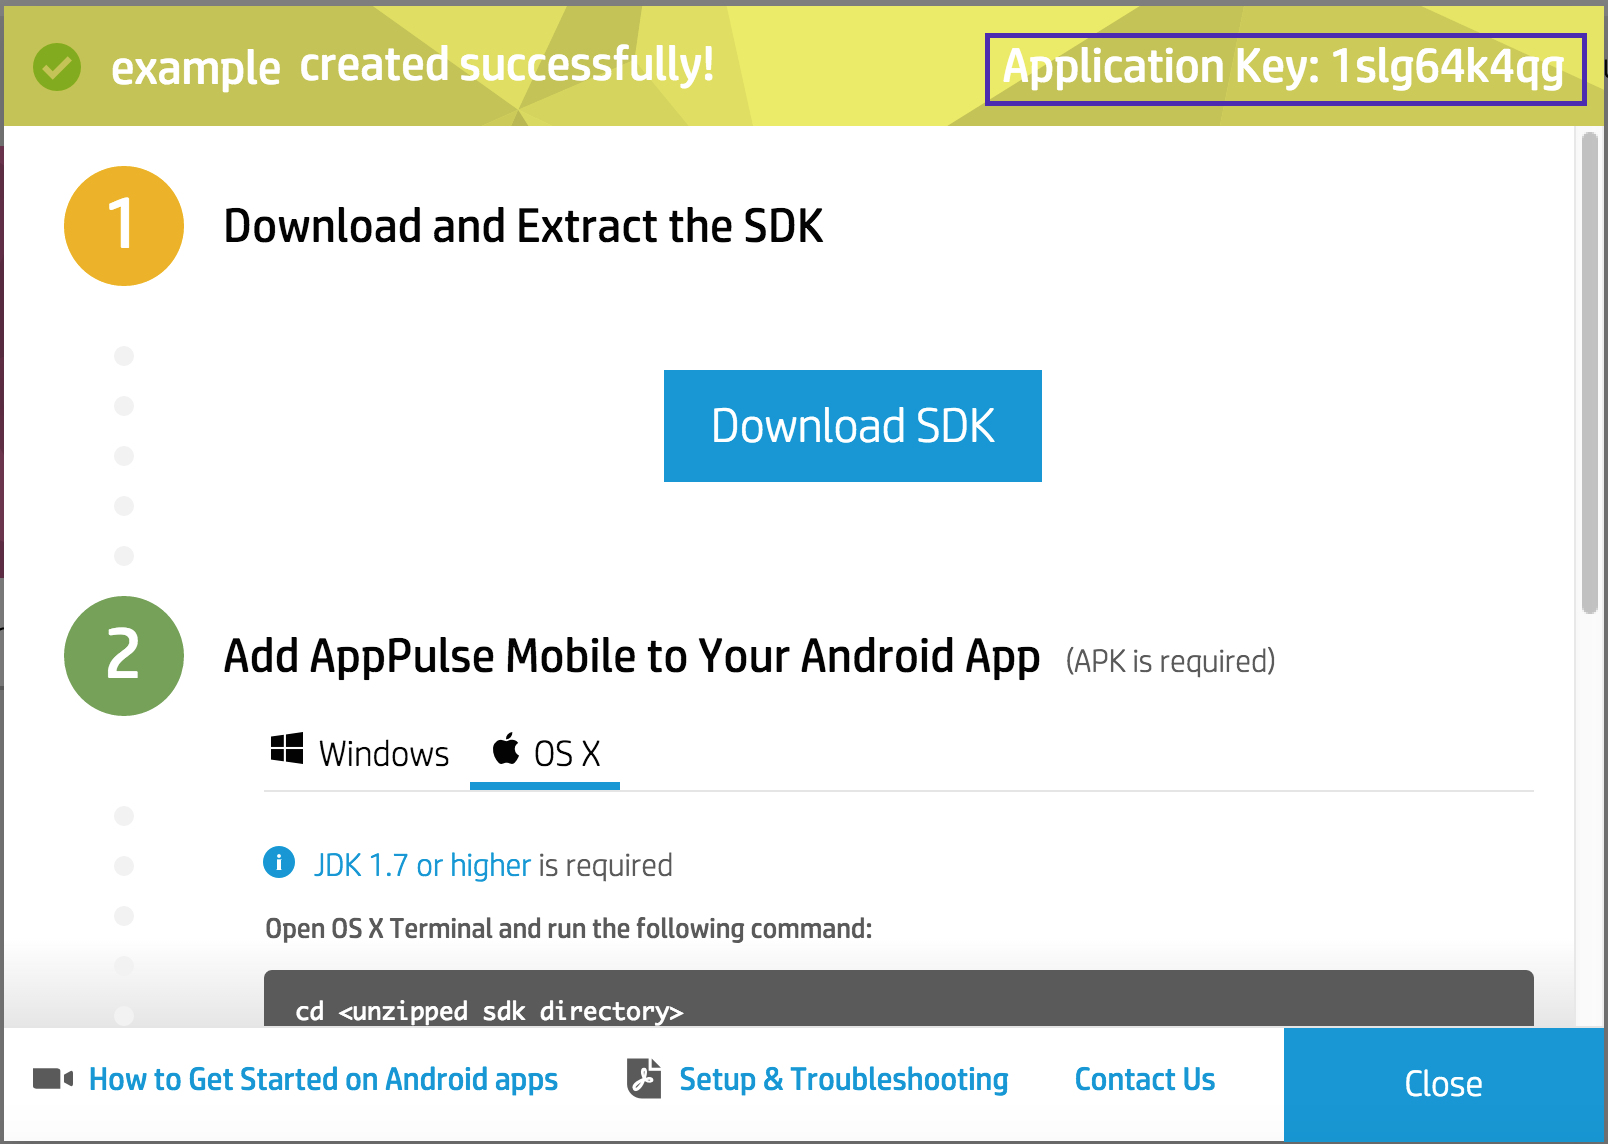
- First, create a new mobile application in AppPulse Mobile. Select Android as the platform, and name your app. Once you create a new app, you will get an application key and a link to download the SDK which you will use to wrap the app.
- Download the Android SDK through the dialog.

Figure 2: Application Creation in HPE AppPulse Mobile - If using Android Studio, the generated apk (app-debug.apk) can be found under:
<Application_Directory>/app/build/outputs/apk/.Use this to create a wrapped apk version through this command:
./AppPulse_mobile.sh -appkey <application key> <path to original apk file>
Example
Seethas-MacBook-Pro:AppPulse_mobile_SDK_2.00_Android seethaa$ ./AppPulse_mobile.sh -appkey 1vw2zcqkjv /Users/seethaa/Desktop/AppPulseMobExample/app/build/outputs/apk/app-debug.apk
infuser version is: 2.00.50.266
Step 1 out of 4: Extracting APK file: /Users/seethaa/Desktop/AppPulseMobExample/app/build/outputs/apk/app-debug.apk
Step 1 completed successfully
Step 2 out of 4: Starting instrumentation process
This step may take several minutes to complete, please wait...
Step 3 completed successfully
Step 4 out of 4: Signing APK in debug mode
Step 4 completed successfully
Instrumentation ended successfully, APK is located at: /Users/seethaa/Desktop/AppPulseMobExample/app/build/outputs/apk/app-debug.apk.signed.debug.apk
The instrumented apk allows AppPulse Mobile to analyze user interactions, and provide analytics data to help developers provide better experiences for their users.
- Install the wrapped apk on devices and run the app, or upload the apk to the Google Play store for general distribution.
Finding Your Performance Problem
In this example, I’m doing a simple HTTP GET call to http://pastebin.org to simulate API data calls which are common for mobile applications. I’m simulating a network delay by using a 7 second delay (http://pastebin.org/7). Sometimes there is a delay somewhere in the network ( too many calls to server at once, server side is slow to send info, user’s network connection is slow, etc ).
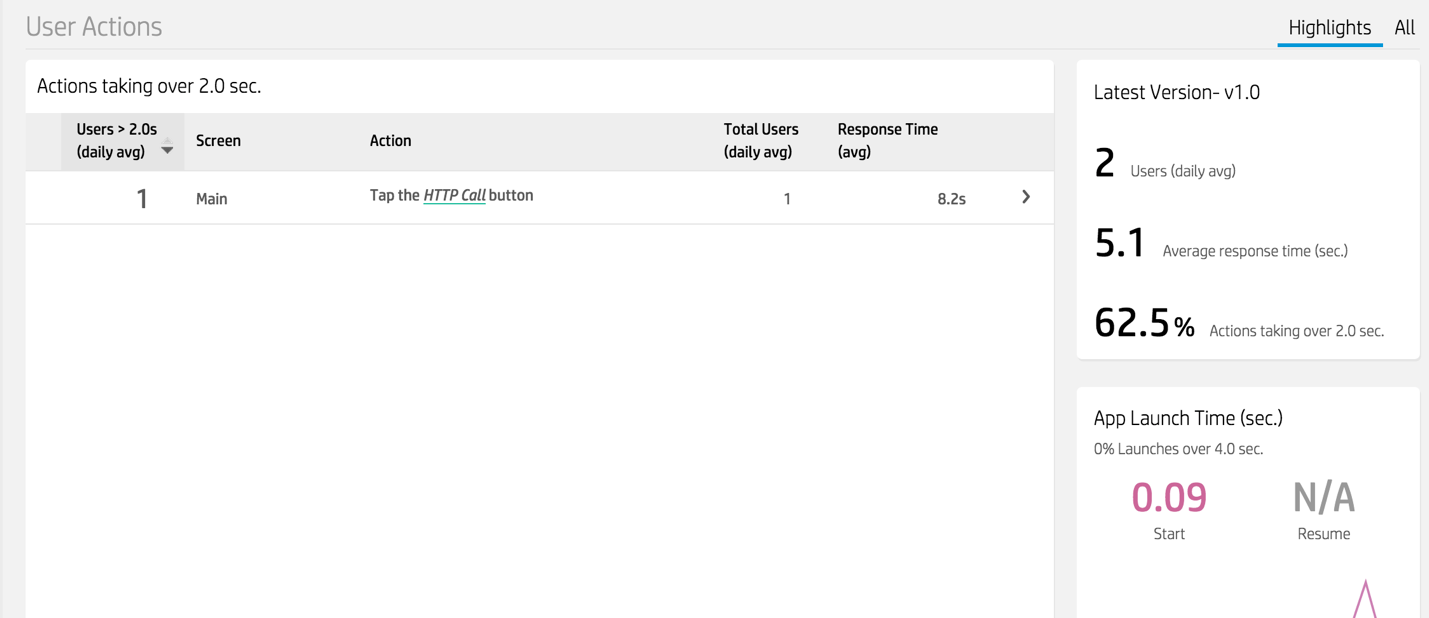
I have an AsyncTask which updates a TextView control with the HTTP response from the pastebin URL. Once you log in to AppPulse Mobile, you will be able to see the UI Performance Overview.

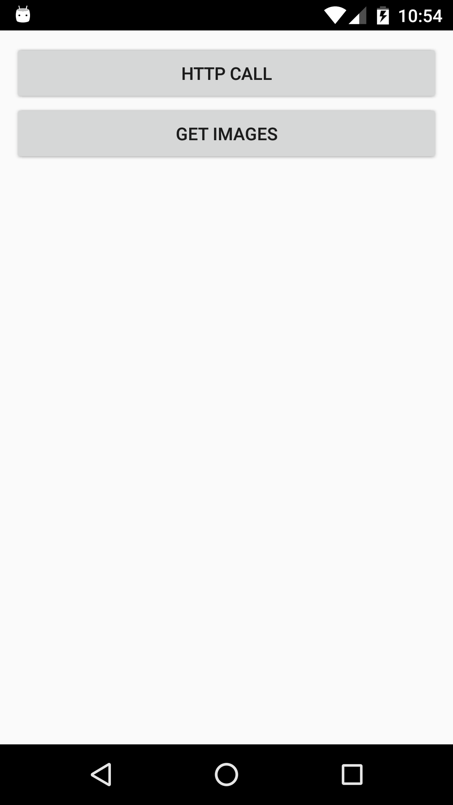
If you have any UI interactions, they will show up in the user actions area so you can see the breakdown of each one individually. In my example, I’ve launched the HTTP request by tapping the “HTTP Call” button so it shows up as such under User Actions. Click a user action to see the HTTP timeline and drill down to see where the slow performance is coming from.
We have two examples below to show how AppPulse Mobile really focuses on the user’s perceived UI performance. In the first example, there is no update to the UI after the HTTP call. In the second example, we have a simple TextView being updated in the onPostExecute() of AsyncTask.

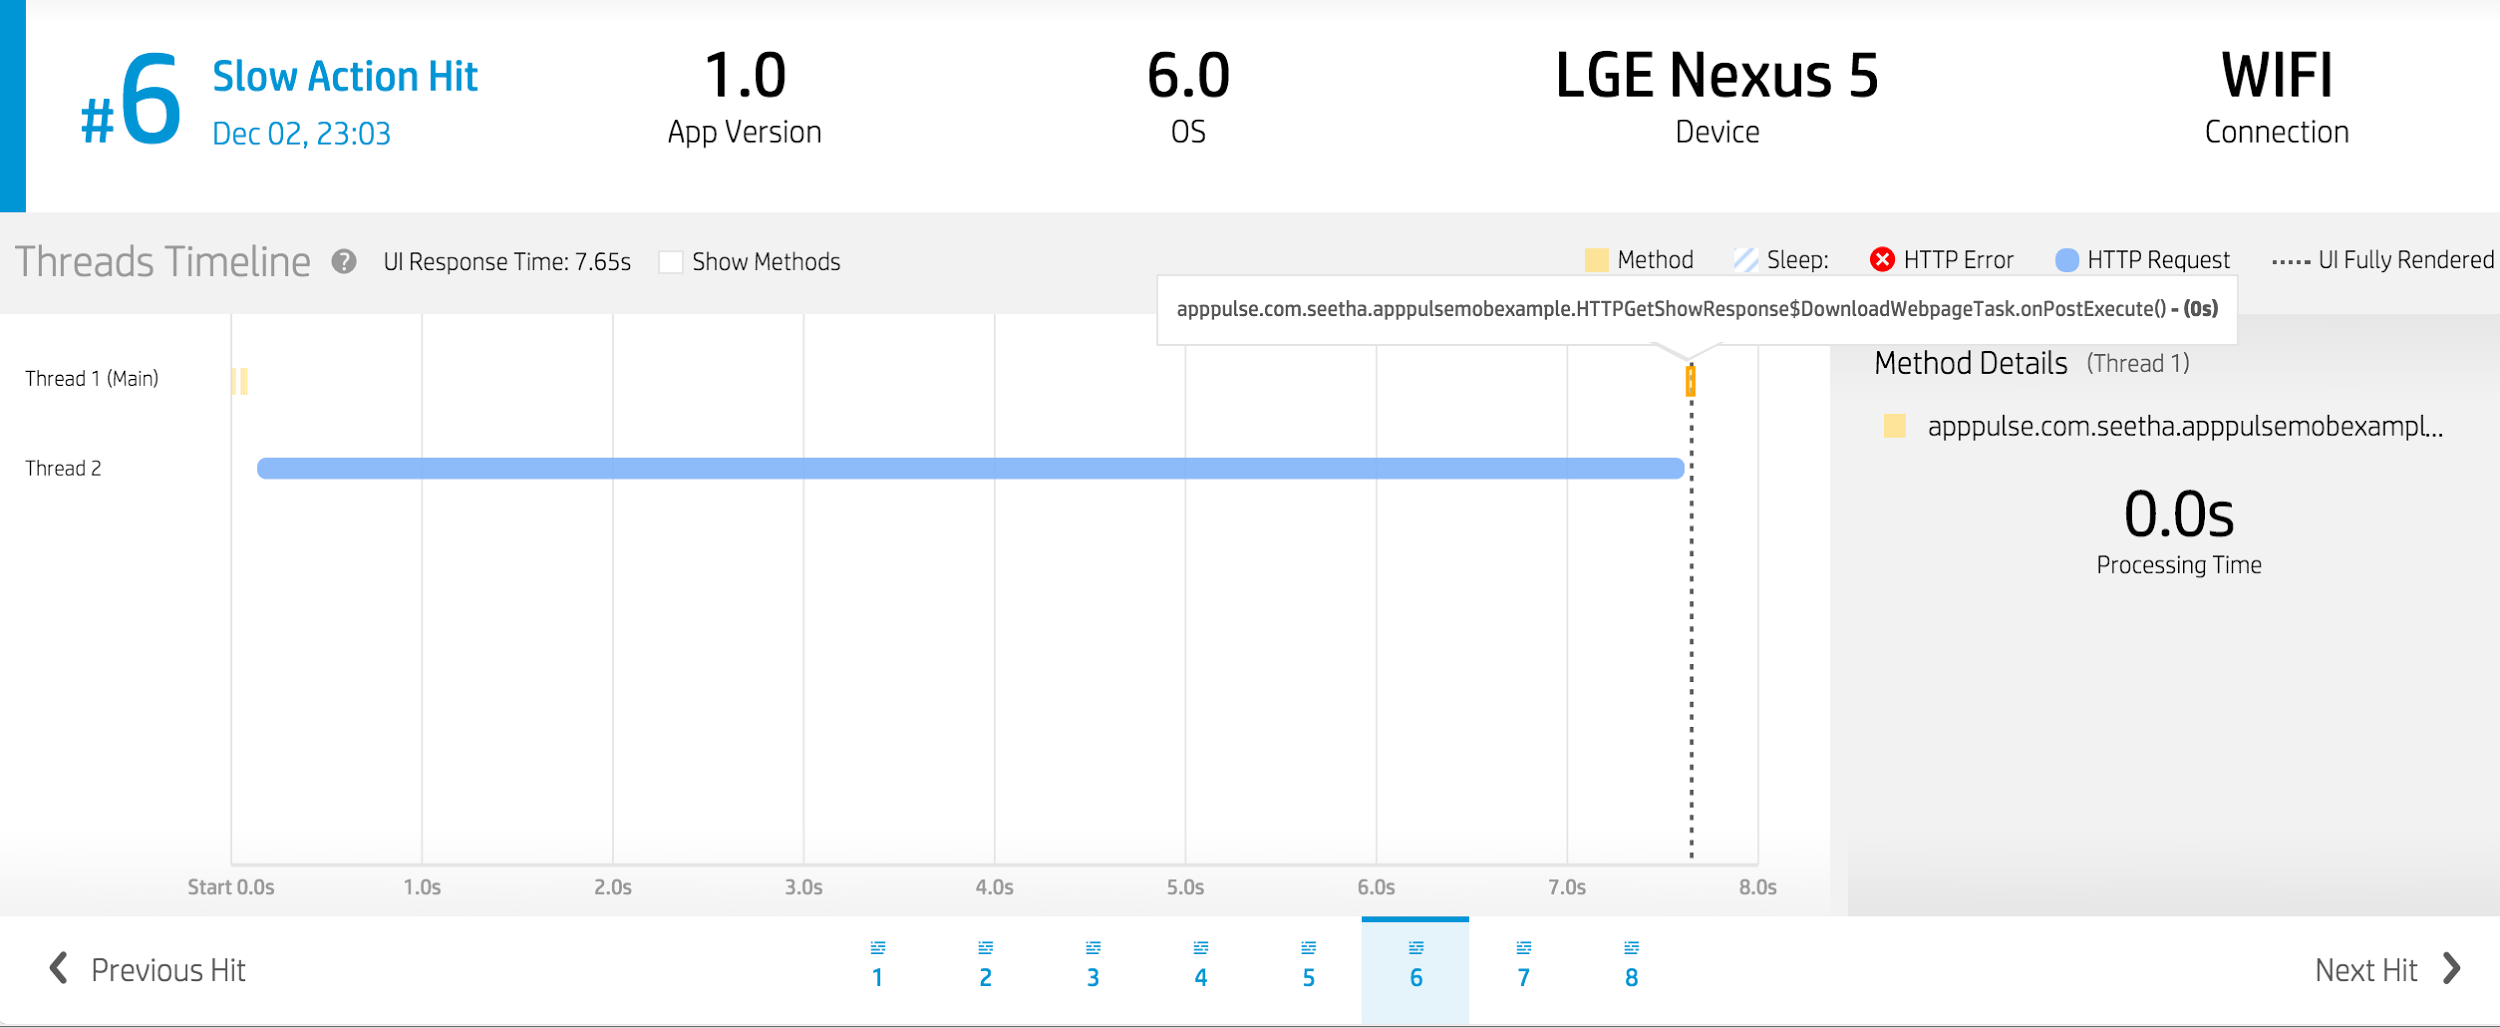
The vertical line indicates the end of UI rendering. In Figure 7, we see that there is a UI update that happens in the onPostExecute() method of AsyncTask. AppPulse Mobile allows us to see the user’s perceived UI performance.
In the above timeline, we can see the URL which causes the delay (http://httpbin.org/delay.7). AppPulse Mobile shows user actions which help the developer understand what real users face while using your app, rather than just network call durations which are not directly related to the user action. By pinpointing where slow performance is occurring, developers can easily figure out how to optimize performance.
UI Rendering Performance Matters!
Often, it is not just network calls that slow down performance for the user. Users want richer and richer experiences with their mobile applications, and attractive images, videos, or Pinterest-style discovery apps are becoming very popular. As this data is loaded on the client-side, there may be delays which causes the user experience to deteriorate.
For this example, I have a folder of mixed blurry and non-blurry pictures that I’d like to do some image processing on. I want to be able to separate the blurry photos from the non-blurry ones and only show the good ones as a GridView. I’m using OpenCV Android SDK to do the image processing.
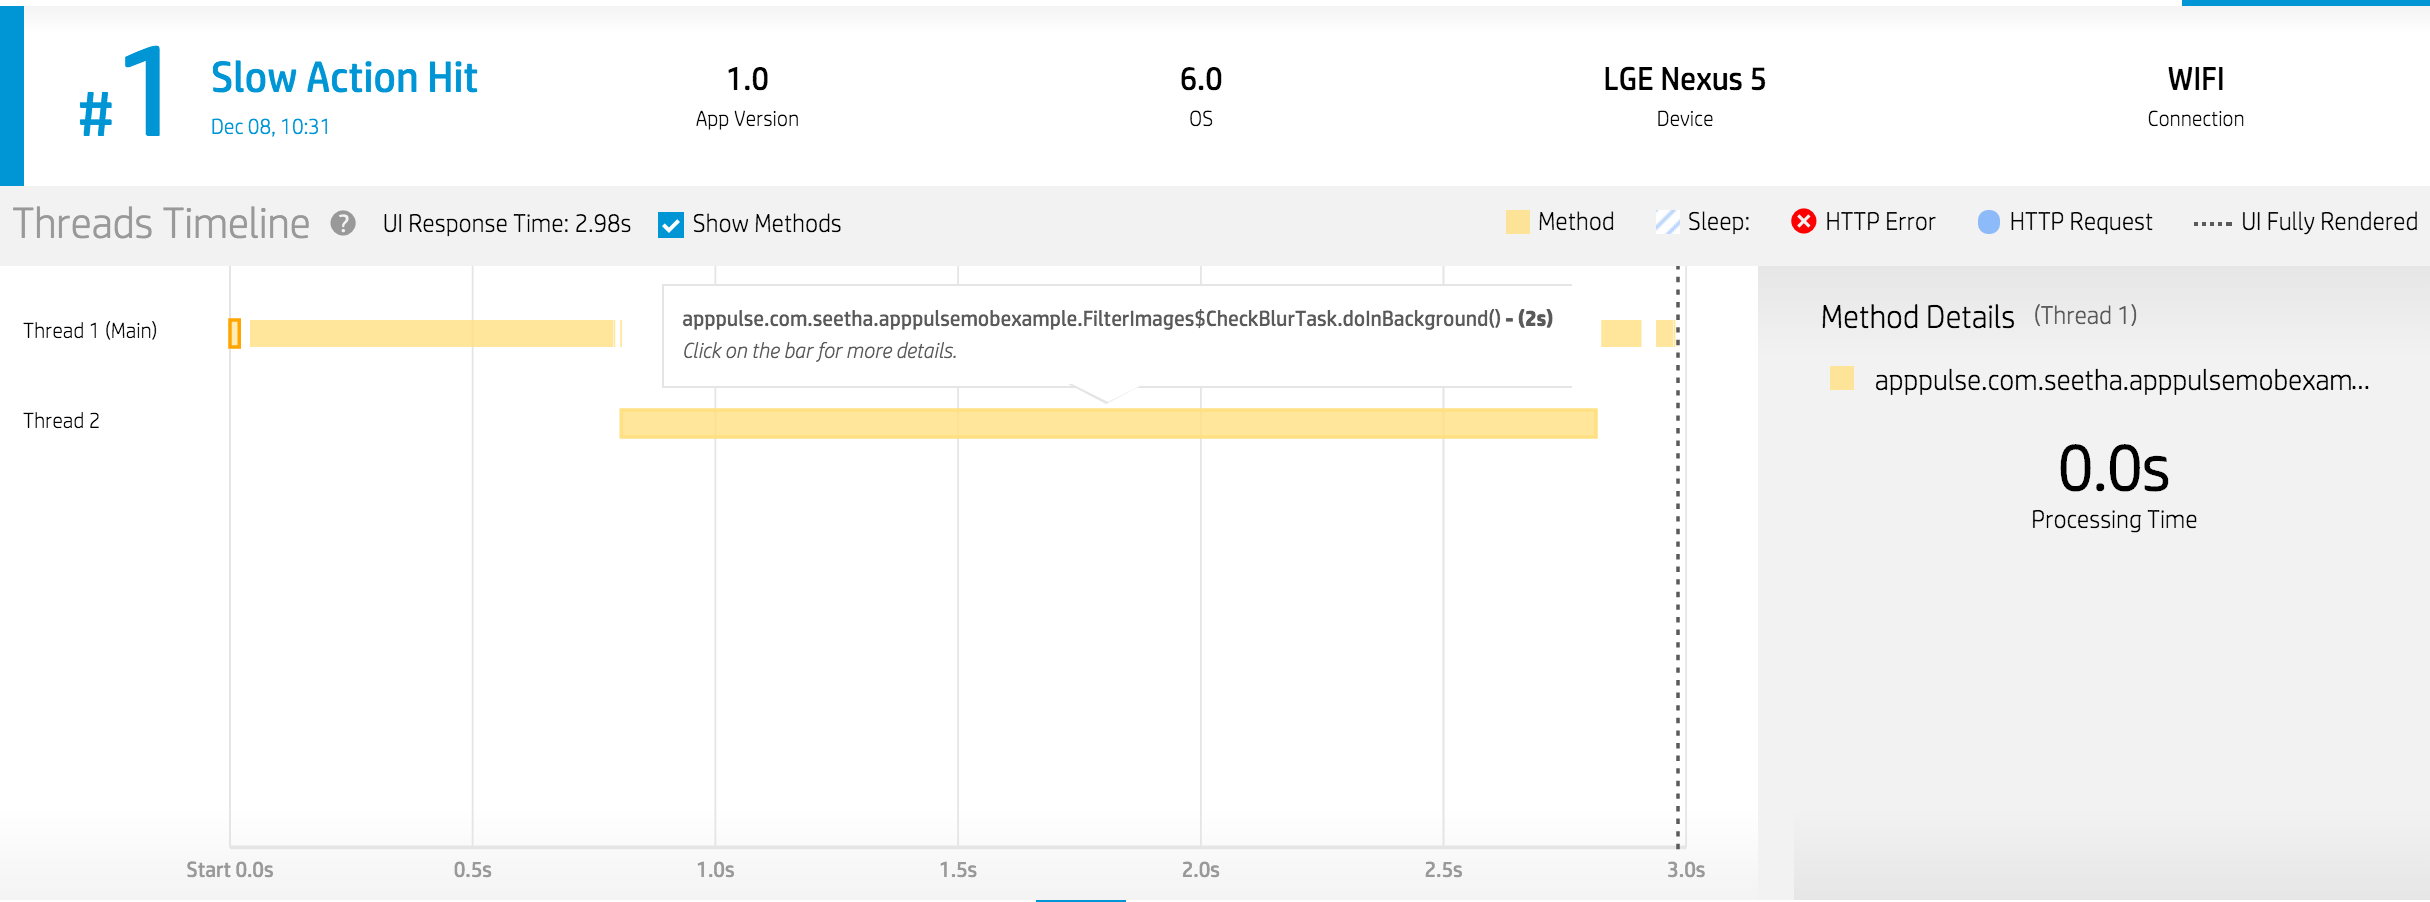
I have a small sample of pictures under sdcard/AppPulseTutorial/. Pressing the “Get Images” button filters through existing images, separating blurred from non-blurred, and then displays the non-blurry pictures. This introduces almost a three second delay for just this small sample set. As the complexity for the app increases, or the type of image processing becomes more sophisticated, performance is likely to drop very low.

A user perceives any delay as a flaw in the application, so monitoring the UI is equally important to understanding network delays. AppPulse Mobile measures performance in the context of a user action, so it really helps in getting the full picture of a user’s experience with the application.
How AppPulse Mobile Method Analysis Can Help
AppPulse Mobile’s Method Analysis is an easy representation of your application’s full client diagnostics. All of the methods executed during your app’s usage are displayed on a timeline, where each line represents a single thread. The first line is the main thread (UI thread), and all subsequent lines show worker threads along with respective methods.
As we saw in the first example, measuring a user’s perceived performance helps to see the real performance that a user is experiencing, rather than just network call durations. In the latter example, we see that not all delays are caused by network calls; UI rendering has become hugely important as apps become richer, and it is valuable to evaluate performance through AppPulse Mobile.
Tips
- If you’re using Android Studio, make sure to run the application on a device as you normally would before adding AppPulse Mobile, so that the wrapped apk contains all new changes.
- If you are launching an interaction in the main thread, it may not come up as a user action in AppPulse Mobile. In this case, click “More on UI Performance,” then click “Start” under “App Launch Time”
- Make sure to select the proper time frame (e.g. “Last 30 days” vs. “Last 24 hrs”) to make sure you see results properly.
- There needs to be a UI interaction (e.g. button, swipe, etc.) in order for AppPulse Mobile to populate it as a user action.
- If you still don’t see user actions listed, make sure that the AppPulse Mobile SDK is installed and working properly on your machine.
- To learn more, and try out AppPulse Mobile yourself, check out http://hp.com/go/AppPulseMobile!
How to get started with HPE AppPulse Mobile for Android in 2 minutes by Dirk de Kok Founder and CEO of Mobtest
