 Phrases such as “unsustainable allocation rate” and “you need to keep your allocation rates low” seem to belong to the vocabulary of Java Champions alone. Complex, scary and surrounded by magic aura.
As it often happens, the magic disappears with a puff of smoke when you look at the concepts more closely. This post is trying to remove the magic from the mentioned terms.
What is allocation rate and why should I care?
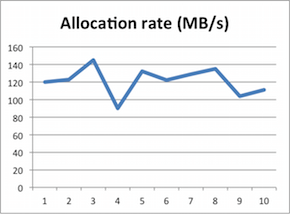
Allocation rate is measured in the amount of memory allocated per time unit. Often it is expressed in MB/sec, but you can use PB/per year if you feel like it. So that is all there is – no magic, just the amount of memory you allocate in your Java code measured over a period of time.
Knowing this fact alone is not too beneficial though. If you can bear with me I will walk you through the practical use of the concept.
Facing high allocation rate can mean trouble for your application’s performance. From the practical standpoint, the impact is surfaced by Garbage Collection becoming a bottleneck. From the hardware standpoint, even commodity hardware can sustain several GB/sec of allocations per core, so in case your rates do not start exceeding 1 GB/sec/core, you can be rather comfortable that your hardware will not actually be the bottleneck.
So, when focusing on the GC, we can start with an analogy that is also true in the real world – if you create a lot of stuff, you tend to face a lot of cleaning afterwards. Knowing that the JVM is built with a garbage collecting mechanism, need to look into how allocation rate changes the frequency or duration of the GC pauses.
Measuring allocation rate
Let us start with the measurement of the allocation rate. For this let’s turn on GC logging by specifying -XX:+PrintGCDetails -XX:+PrintGCTimeStamps flags for the JVM. The JVM now starts logging the GC pauses in a similar way to the following snippet:
0.291: [GC (Allocation Failure) [PSYoungGen: 33280K->5088K(38400K)] 33280K->24360K(125952K), 0.0365286 secs] [Times: user=0.11 sys=0.02, real=0.04 secs]
0.446: [GC (Allocation Failure) [PSYoungGen: 38368K->5120K(71680K)] 57640K->46240K(159232K), 0.0456796 secs] [Times: user=0.15 sys=0.02, real=0.04 secs]
0.829: [GC (Allocation Failure) [PSYoungGen: 71680K->5120K(71680K)] 112800K->81912K(159232K), 0.0861795 secs] [Times: user=0.23 sys=0.03, real=0.09 secs]
From the GC log above, we can calculate the allocation rate as the difference between the Young Generation size after the last collection completed and before the next one started. Using the example above, we can for example extract the following information:
- At 291ms after the JVM was launched 33,280K of objects were created. First minor GC event cleaned the Young generation, after which there was 5,088K of objects in the Young generation left.
- At 446ms after launch, the Young gen occupancy had grown to 38,368K triggering next GC, which managed to reduce the Young Gen occupancy to 5,120K.
- At 829ms after the launch, Young gen size was 71,680K and the GC reduced it again to 5,120K.
This data can then be expressed in the following table calculating the allocation rate as deltas of the Young occupancy:
| Event | Time | Young before | Young after | Allocated during | Allocation rate |
|---|---|---|---|---|---|
| 1st GC | 291ms | 33,280KB | 5,088KB | 33,280KB | 114MB/sec |
| 2nd GC | 446ms | 38,368KB | 5,120KB | 33,280KB | 215MB/sec |
| 3rd GC | 829ms | 71,680KB | 5,120KB | 66,560KB | 174MB/sec |
| Total | 829ms | N/A | N/A | 133,120KB | 161MB/sec |
Having this information allows us to say that this particular piece of software had the allocation rate of 161 MB/sec during the period of measurement.
Analyzing the impact
Now, being equipped with this information we can understand how the changes in allocation rate affect application throughput by increasing or reducing the frequency of GC pauses. First and foremost, you should notice that only Minor GC pauses cleaning the Young Generation are affected. The frequency nor duration of the GC pauses cleaning the Old Generation is not directly impacted by allocation rate, but instead by promotion rate, a term that we will cover in our next post.
Knowing that we can focus only on Minor GC pauses, we should next look into the different memory pools inside the Young Generation. As the allocation takes place in Eden, we can immediately look into how sizing the Eden can impact the allocation rate. So we can have a hypothesis that increasing the size of Eden will reduce the frequency of minor GC pauses and thus allow the application to sustain faster allocation rates.
And indeed, when running the same example with different Eden sizes using -XX:NewSize -XX:MaxNewSize & -XX:SurvivorRatio parameters, we can see two-fold difference in allocation rates
- Running the above example with 100M of Eden, reduces the allocation rate to below 100MB/sec
- Increasing Eden size to 1GB, increases the allocation rate to just below 200MB/sec.
If you are still wondering why this can be true – if you stop your application threads for GC less frequently you can do more useful work. More useful work also happens to create more objects, thus supporting the increased allocation rate.
Now, before you jump to conclusion that “bigger Eden is better”, you should notice that allocation rate might and probably does not directly correlate to the actual throughput of your application. It is a technical measurement, contributing to throughput. Allocation rate can and will have an impact on how frequently your Minor GC pauses stop application threads, but to see the overall impact, you need to take into account also Major GC pauses and measure throughput not in MB/sec but in business operations your application provides.
| Reference: | What is allocation rate? from our JCG partner Nikita Salnikov Tarnovski at the Plumbr Blog blog. |
