In particular in this post we will discuss:
- Garbage created by java.concurrent.Lock
- Comparing Lock to synchronized
- How to measure latency programatically
- The impact of contention on Lock and synchronized
- The impact of co-ordinated omission on latency tests
Back to one of my favourite topics garbage creation / allocation. See my previous posts (e.g. First rule of performance optimisation and Revisiting the First Rule of Performance Optimisation: Effects of Escape Analysis) for more details on this subject. Especially why allocation is such a critical factor in understanding performance issues.
Something I came across a couple of days ago while I was trying to diagnose some strange effects of allocation during JIT compilation was that java.util.concurrent.locks.ReentrantLock allocates, but only when under contention. (This can be easily proved by running a test program (like the one below) creating contention on Lock with – verbosegc).
Sample gc output for contended Lock below:
[GC (Allocation Failure)  16384K->1400K(62976K), 0.0016854 secs]
[GC (Allocation Failure)  17784K->1072K(62976K), 0.0011939 secs]
[GC (Allocation Failure)  17456K->1040K(62976K), 0.0008452 secs]
[GC (Allocation Failure)  17424K->1104K(62976K), 0.0008338 secs]
[GC (Allocation Failure)  17488K->1056K(61952K), 0.0008799 secs]
[GC (Allocation Failure)  17440K->1024K(61952K), 0.0010529 secs]
[GC (Allocation Failure)  17408K->1161K(61952K), 0.0012381 secs]
[GC (Allocation Failure)  17545K->1097K(61440K), 0.0004592 secs]
[GC (Allocation Failure)  16969K->1129K(61952K), 0.0004500 secs]

[GC (Allocation Failure)  17001K->1129K(61952K), 0.0003857 secs]
I wondered whether the garbage collections necessary to clean up these allocations would mean that Lock, in a highly contended environment, would be a worse choice for synchronisation than using the in-built ‘synchronized‘.
Of course the question is more academic than anything else. If you really did care that much about latency, you would never (or certainly should never) find yourself in a situation where so much thread locking would be necessary. Nevertheless stay with me because the process and results are interesting.
A bit of history. Locks were introduced into Java in version 1.5 in 2004. Locks together with the rest of the concurrent utilities were desperately needed to simplify concurrency constructs. Up to that point you had deal with the built-in synchronized and wait()notify() on Object.
ReentrantLock offers much functionality over and above synchronized,
to name but a few:
- Being unstructured – i.e. you are not limited to using it in a block or method. It allows you hold the lock over several methods.
- Lock polling
- Time out waiting for the lock
- Configurable fairness policy
But how do they perform in terms of latency test?
I wrote a simple test below to compare the performance of Lock against synchronized.
- The code allows you to vary the number of threads (1 thread means that there is no contention) and thus adjust the amount of contention.
- To measure with and without coordinated omission (see previous blog Effects of Coordinated Omission)
- To run testing Lock or testing synchronised.
- To record my results you will notice that I used a
Histogramclass. This was created by Peter Lawrey. You can find the class as a utility in Chronicle-Core over here.
import org.junit.Test;

import java.util.concurrent.locks.Lock;
import java.util.concurrent.locks.ReentrantLock;

public class LockVsSync {
    private static final boolean COORDINATED_OMISSION = Boolean.getBoolean("coordinatedOmission");
    //Either run testing Lock or testing synchronized
    private static final boolean IS_LOCK = Boolean.getBoolean("isLock");
    private static final int NUM_THREADS = Integer.getInteger("numThreads");

    @Test
    public void test() throws InterruptedException {
        Lock lock = new ReentrantLock();
        for (int t = 0; t < NUM_THREADS; t++) {
            if (t == 0) {
                //Set the first thread as the master which will be measured
                //The other threads are only to cause contention
                Runner r = new Runner(lock, true);
                r.start();
            } else {
                Runner r = new Runner(lock, false);
                r.start();
            }
        }

        synchronized(this){
            //Hold the main thread from completing
            wait();
        }

    }

    private void testLock(Lock rlock) {
        rlock.lock();
        try {
            for (int i = 0; i < 2; i++) {
                double x = 10 / 4.5 + i;
            }
        } finally {
            rlock.unlock();
        }
    }

    private synchronized void testSync() {
        for (int i = 0; i < 2; i++) {
            double x = 10 / 4.5 + i;
        }
    }

    class Runner extends Thread {
        private Lock lock;
        private boolean master;

        public Runner(Lock lock, boolean master) {
            this.lock = lock;
            this.master = master;
        }

        @Override
        public void run() {
            Histogram histogram = null;
            if (master)
                histogram = new Histogram();

            long rate = 1000;//expect 1 every microsecond
            long now =0;
            for (int i = -10000; i < 200_000_000; i++) {
                if(i==0){
                    now = System.nanoTime();
                } else if(i>0){
                    if(!COORDINATED_OMISSION) {
                        now += rate;
                        while(System.nanoTime() < now)
                            ;
                    }else
                        now = System.nanoTime();
                }
                if(IS_LOCK)
                    testLock(lock);
                else
                    testSync();

                if(i>=0 && master){
                    histogram.sample(System.nanoTime() - now);
                }
            }
            if (master) {
                System.out.println(histogram.toMicrosFormat());
                System.exit(0);
            }
        }
    }
}
So here are the results:
These are the results where co-ordinated omission was ignored:
- The times are measured in microseconds.
- The latency distribution is across the top of the graph.
- Contention in this test meant running the program it with 4 threads.
- The tests were run on an MBP i7 with 8 logical CPUs.
- Each test comprised of 200,000,000 iterations with a 10,000 iteration warmup.
- Throughput when adjusting for co-ordinated omission was 1 iteration/microsecond.
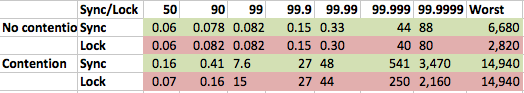
As expected, without contention the results are pretty much the same. The JIT will have optimised away the Lock and synchronized.
With contention using Lock was marginally faster in the lower percentiles but again really not much in it. So even though there were many minor garbage collections they don’t seem to have had a noticeable effect slowing down the Lock. If anything Lock is slightly faster overall.
These are the results adjusted for co-ordinated omission.
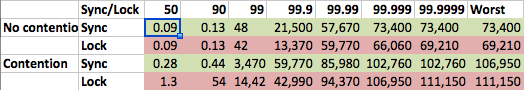
The numbers are of course higher as they allow for the true latency caused.
Again with no contention the lock and synchronized perform the same – no great surprises there.
With contention, up to the 99th percentile we now see synchronized outperforming lock by 10X. After that the times were pretty much the same.
I could speculate that effects of the gc collections, which are between between 300-1200 microseconds, are the cause of the slowness of the lock compared to synchronised. This is especially because the slowdown is apparent only up to the 99th percentile – after this the latencies are probably down to hardware and OS. However that would be just speculation on my part without further investigation.
Conclusion
The take away from this post is more about the process involved to measure and analyse latencies. It is interesting that Lock allocates when contended but is unlikely to make any practical difference in the real world
| Reference: | A Case Study in Analysing Latency: Lock vs Synchronized from our JCG partner Daniel Shaya at the Rational Java blog. |
