The following is an example from our Garbage Collection Handbook which will be published in the forthcoming weeks. In the meanwhile, take your time to get yourself familiar with the basics of the Garbage Collection – this is going to be the very first chapter of the book.
At the first sight, garbage collection should be dealing with what the name suggests – finding and throwing away the garbage. In reality it is doing exactly the opposite. Garbage Collection is tracking down all the objects which are still used and marks the rest as garbage. Bearing this in mind, we start digging into more details how the process of automated memory reclamation called “Garbage Collection” is implemented for Java Virtual Machine.
Manual Memory Management
Before we can start covering Garbage Collection in its modern form, let’s do a quick recap of days where you had to manually and explicitly allocate and free memory for your data. And if you ever forgot to free it, you would not be able to reuse the memory. The memory would be claimed but not used. Such a scenario is called a memory leak.
Here is a simple example written in C using manual memory management:
int send_request() {
    size_t n = read_size();
    int *elements = malloc(n * sizeof(int));

    if(read_elements(n, elements) < n) {
        // elements not freed!
        return -1;
    }

    // …

    free(elements)
    return 0;
}
As we can see, it is fairly easy to forget to free memory. Memory leaks used to be a lot more common problem than now. You could only really fight them by fixing your code. Thus, a much better approach would be to automate the reclamation of unused memory, eliminating the possibility of human error altogether. Such automation is called Garbage Collection (or GC for short).
Smart Pointers
One of the first ways to automate garbage collection was built upon reference counting. For each object, you just know how many times it is referred to, and when that count reaches zero, the object can be safely reclaimed. A well-known example of that would be the shared pointers of C++:
int send_request() {
    size_t n = read_size();
    stared_ptr<vector<int>> elements
              = make_shared(new vector<int>());

    if(read_elements(n, elements) < n) {
        return -1;
    }

    return 0;
}
The shared_ptr that we are making use of keeps track of the number of references to it. This number increases as you pass it around and decreases as it leaves scope. As soon as the number of references reaches zero, the shared_ptr automatically deletes the underlying vector.
Automated Memory Management
In the C++ code above, we still had to explicitly say when we want to have memory management to be taken care of. But what if we could make all the objects behave this way? That would be very handy, since the developer may no longer has to think about cleaning up after himself. The runtime will automatically understand that some memory is no longer used, and free it. In other words, it automatically collects the garbage. The first garbage collector was there in 1959 for Lisp, and the technology has only advanced since then.
Reference Counting
The idea that we have demonstrated with the shared pointers of C++ can be applied to all the objects. Many languages such as Perl, Python or PHP, take this approach. This is best illustrated with a picture:
The green clouds represent that the object that they point to is still in use by the programmer. Technically, these may be things like a local variable in the method currently executing or a static variable, or more. It may vary from programming language to programming language, so we will not focus here.
The blue circles are the objects in memory, you can see the number of references to them. Finally, the grey circles are objects which are not referenced from any of the scopes. The grey objects are thus garbage and could be cleaned by the Garbage Collector.
This all looks really good, does it not? Well, it does, but the whole method has a huge drawback. It is quite easy to end up with a detached cycle of objects, none of which is in scope, but due to cyclic references the count of their reference is not zero. Here’s an illustration:

See? The red objects are in fact garbage that the application does not use. But due to the limitations of reference counting, there is still a memory leak.
There are some ways to overcome this, like using special “weak” kind of references, or applying a separate algorithm for collecting cycles. The mentioned languages, Perl, Python and PHP, all handle cycles in one way or another, but this is outside the scope of this handbook. Instead, we will start investigating the approach taken by the JVM in more details.
Mark and Sweep
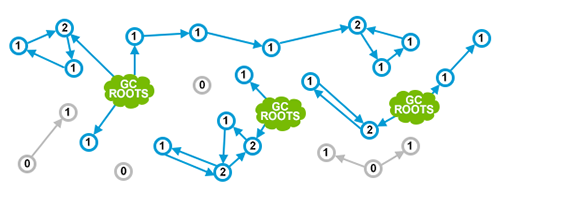
First of all, the JVM is more specific about what constitutes reachability of an object. Instead of the vaguely defined green clouds that we saw on earlier chapters, we have a very specific and explicit set of objects that are called the Garbage Collection Roots:
- Local variables
- Active threads
- Static fields
- JNI references
- Others (will be discussed later)
The method used by JVM to track down all the reachable (live) objects and make sure the memory claimed by non-reachable objects can be reused is called Mark and Sweep algorithm. It consists of two steps:
- Marking is walking through all reachable objects and keeping a ledger in native memory about all such objects
- Sweeping is making sure the memory addresses occupied by non-reachable objects can be reused by next allocations.
Different GC algorithms within the JVM, such as Parallel Scavenge, Parallel Mark+Copy or CMS are implementing those phases slightly differently, but at conceptual level the process remains similar to the two steps described above.
A crucially important thing about this approach is that the cycles are no longer leaked:
The not-so-good thing is that the application threads need to be stopped for the collection to happen as you cannot really count references if they keep changing all the time. Such a situation when the application is temporarily stopped so that the JVM can indulge in housekeeping activities is called a Stop The World pause. They may happen for many reasons, but garbage collection is by far the most popular one.
If you managed to get this far with the post, I can only recommend subscribing to our Twitter feed where we keep posting on different Java performance related topics.
| Reference: | What is Garbage Collection? from our JCG partner Gleb Smirnov at the Plumbr Blog blog. |
