This post is analyzing why and how Plumbr Agents extended the length of GC pauses on certain occasions. Troubleshooting the underlying problem revealed interesting insights about how JVMTI tagging is handled during GC pauses.
Spotting a problem
One of our customers complained about the application being significantly less responsive with the Plumbr Agent attached. Upon analyzing the GC logs, we found an anomaly in the GC times. Here is the GC log snipped from the JVM without Plumbr:
2015-01-30T17:19:08.965-0200: 182.816: [Full GC (Ergonomics)
[PSYoungGen: 524800K->0K(611840K)]
[ParOldGen: 1102620K->1103028K(1398272K)] 1627420K->1103028K(2010112K),
[Metaspace: 2797K->2797K(1056768K)], 0.9563188 secs]
[Times: user=7.32 sys=0.01, real=0.96 secs]
And here’s one with the Plumbr Agent attached:
2015-02-02T17:40:35.872-0200: 333.166: [Full GC (Ergonomics)
[PSYoungGen: 524800K->0K(611840K)]
[ParOldGen: 1194734K->1197253K(1398272K)] 1719534K->1197253K(2010112K),
[Metaspace: 17710K->17710K(1064960K)], 1.9900624 secs]
[Times: user=7.94 sys=0.01, real=1.99 secs]
The anomaly is hidden in the elapsed time. The real time, is the actual time that has passed. If you looked at a stopwatch in your hand, real time would be equal to that number. The user time (plus the system time) is the total CPU time that has been consumed during the measurement. It can be greater than the real time if there are multiple threads on multiple cores. So, for the Parallel GC, the real time should be roughly equal to (user time / number of threads). On my machine this ratio should be close to 7 and it indeed was so without Plumbr Agent. But with Plumbr, this ratio significantly plunged. Definitely not okay!
Initial Investigation
Given such evidence, the following are the most likely hypotheses:
- Plumbr causes the JVM to do some heavy single-threaded operation after each GC
- Plumbr causes the JVM to use fewer threads for garbage collection
But looking at just one line in the GC log gives too narrow view to proceed, so we went ahead and visualized the aforementioned ratios:
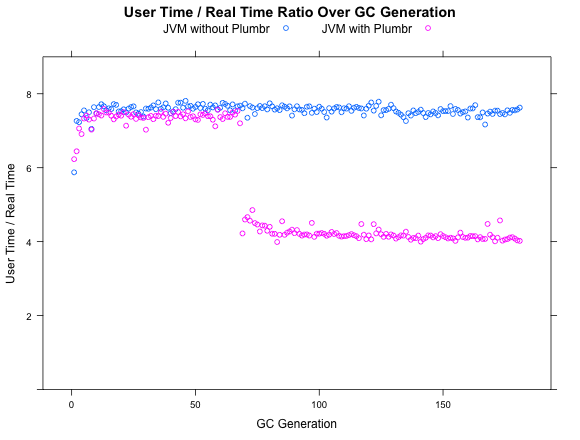
The drop on the chart occurs at exactly the moment where Plumbr discovers the memory leak. Some extra burden to the GC during the root cause analysis was expected, but permanently affecting the GC pause length was definitely not a feature we had deliberately designed into our Agent. Such behavior favors the first hypothesis since it is very unlikely that we can influence the number of GC threads at runtime.
Creating an isolated test case took a while, but with the help of the following constraints, we could nail it:
- The application must leak memory for Plumbr to detect
- The application must frequently pause for garbage collection
- … and as the breaking moment – the application must have a large live set, meaning that the number of objects surviving a Full GC must be large.
After having compiled a small enough test case, it was possible to zoom into the root cause detection. A sound approach was to switch individual features of the Plumbr Agent on and off and see in which configurations the issue would reproduce.
With this simple search, we managed to pinpoint the issue to a single action that Plumbr Agent does. The problem disappeared with JVMTI tagging turned off. During our analysis of path to gc root and reference chain, we tag every single object on the heap. Apparently, the GC times were somehow affected by the tags we generated.
Finding The Underlying Root Cause
Still, it was not clear why the GC pauses were extended. The garbage is quickly collected, and most of the tagged objects are supposed to be eligible for GC. What was discovered, though, was that with a large live set (which is one of the symptoms of a memory leak), a lot of tagged objects are retained.
But hey, even if all the objects in the live set are tagged, this is not supposed to linearly affect the GC time. After GC is done, we receive notifications on all of our tagged objects that were collected, but the live set is not among those objects. This leads one to wonder if HotSpot, for some bizarre reason, iterates through all the tagged objects after each GC.
To verify the claim one may take a look at the hotspot source code. After some digging, we eventually arrived at JvmtiTagMap::do_weak_oops, which indeed iterates over all the tags and does a number of not-so-cheap operations for all of them. To make things worse, this operation is performed sequentially and is not parallelized. And last piece of the puzzle was solved after finding the chain of invocations calling this method after each garbage collection. (Why it’s done the way it’s done and what it has to do with weak references is quite beyond the scope of this article)
Running on Parallel GC and having as expensive operation as that running serially might initially seem like a design flaw. On the second thought, the JVMTI creators probably never expected anyone to tag all the heap and thus never bothered to heavily optimize this operation, or run it in parallel. After all, you can never predict all the ways in which people will use the features you designed, so maybe it is worth checking whether the post-GC activities in Hotspot should also get a chance to use all the gazillion cores a modern JVM tends to have access to.
So, to counter this, we needed to clean up the tags that we do not need any more. Fixing it was as easy as adding merely three lines to one of our JVMTI callbacks:
+ if(isGenerated(*tag_ptr)) {
+ *tag_ptr = 0;
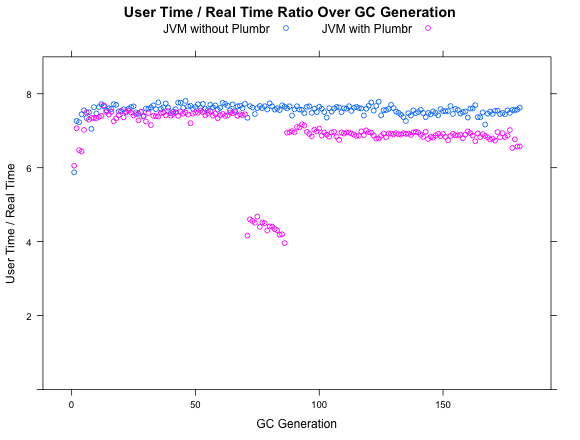
+ }And lo and behold, once the analysis is complete, we are almost as good as we were at the start. As seen in the following screenshot, there still is a temporary performance flux during the memory leak discovery and a slight deterioration after the memory leak analysis was completed:
Wrapping it up
The patch is now rolled out and the situation where the GC pause times were affected after Plumbr detected a leak is now fixed. Feel free to go and grab an updated Agent to tackle the performance issues.
As a take-away, I can recommend to be extra careful with extensive tagging, as the “cheap” tags can pile up on corner cases building a cornerstone for a massive performance penalty. To make sure you are not abusing the tagging, flip the diagnostic option of –XX:+TraceJVMTIObjectTagging. It will allow you to get an estimate of how much native memory the tag map consumes and how much time the heap walks take..
| Reference: | How JVMTI tagging can affect GC pauses from our JCG partner Gleb Smirnov at the Plumbr Blog blog. |
