“Hey, can you drop by and take a look at something weird”. This is how I started to look into a support case leading me towards this blog post. The particular problem at hand was related to different tools reporting different numbers about the available memory.
In short, one of the engineers was investigating the excessive memory usage of a particular application which, by his knowledge was given 2G of heap to work with. But for whatever reason, the JVM tooling itself seemed to have not made up their mind on how much memory the process really has. For example jconsole guessed the total available heap to be equal to 1,963M while jvisualvm claimed it to be equal to 2,048M. So which one of the tools was correct and why was the other displaying different information?
It was indeed weird, especially seeing that the usual suspects were eliminated – the JVM was not pulling any obvious tricks as:
- -Xmx and -Xms were equal so that the reported numbers were not changed during runtime heap increases
- JVM was prevented from dynamically resizing memory pools by turning off adaptive sizing policy (-XX:-UseAdaptiveSizePolicy)
Reproducing the difference
First step toward understanding the problem was zooming in to the tooling implementation. Access to available memory information via standard APIs is as simple as following:
System.out.println("Runtime.getRuntime().maxMemory()="+Runtime.getRuntime().maxMemory());And indeed, this was what the tooling at hand seemed to be using. First step towards having an answer to question like this is to have reproducible test case. For this purpose I wrote the following snippet:
package eu.plumbr.test;
//imports skipped for brevity

public class HeapSizeDifferences {

  static Collection<Object> objects = new ArrayList<Object>();
  static long lastMaxMemory = 0;

  public static void main(String[] args) {
    try {
      List<String> inputArguments = ManagementFactory.getRuntimeMXBean().getInputArguments();
      System.out.println("Running with: " + inputArguments);
      while (true) {
        printMaxMemory();
        consumeSpace();
      }
    } catch (OutOfMemoryError e) {
      freeSpace();
      printMaxMemory();
    }
  }

  static void printMaxMemory() {
    long currentMaxMemory = Runtime.getRuntime().maxMemory();
    if (currentMaxMemory != lastMaxMemory) {
      lastMaxMemory = currentMaxMemory;
      System.out.format("Runtime.getRuntime().maxMemory(): %,dK.%n", currentMaxMemory / 1024);
    }
  }

  static void consumeSpace() {
    objects.add(new int[1_000_000]);
  }

  static void freeSpace() {
    objects.clear();
  }
}
The code is allocating chunks of memory via new int[1_000_000] in a loop and checking for the memory currently known to be available for the JVM runtime. Whenever it spots a change to the last known memory size, it reports it by printing the output of Runtime.getRuntime().maxMemory() similar to the following:
Running with: [-Xms2048M, -Xmx2048M]
Runtime.getRuntime().maxMemory(): 2,010,112K.
Indeed – even though I had specified the JVM to use 2G of heap, the runtime somehow is not able to find 85M of it. You can double-check my math by converting the output of Runtime.getRuntime().maxMemory() to MB by dividing the 2,010,112K by 1024. The result you will get equals 1,963M, differentiating from 2048M by exactly 85M.
Finding the root cause
After being able to reproduce the case, I took the following note – running with the different GC algorithms also seemed to produce different results:
| GC algorithm | Runtime.getRuntime().maxMemory() |
|---|---|
| -XX:+UseSerialGC | 2,027,264K |
| -XX:+UseParallelGC | 2,010,112K |
| -XX:+UseConcMarkSweepGC | 2,063,104K |
| -XX:+UseG1GC | 2,097,152K |
Besides G1, which is consuming exactly the 2G I had given to the process, every other GC algorithm seemed to consistently lose a semi-random amount of memory.
Now it was time to dig into the source code of the JVM where in source code of the CollectedHeap I discovered the following:
// Support for java.lang.Runtime.maxMemory():  return the maximum amount of
// memory that the vm could make available for storing 'normal' java objects.
// This is based on the reserved address space, but should not include space
// that the vm uses internally for bookkeeping or temporary storage
// (e.g., in the case of the young gen, one of the survivor
// spaces).
virtual size_t max_capacity() const = 0;
The answer was rather well-hidden I have to admit that. But the hint was still there for the truly curious minds to find – referring to the fact that in some cases one of the survivor spaces might be excluded from heap size calculations.
From here it was tailwinds all the way – turning on the GC logging discovered that indeed, with 2G heap the Serial, Parallel and CMS algorithms all set the survivor spaces to be sized at exactly the difference missing. For example, on the ParallelGC example above, the GC logging demonstrated the following:
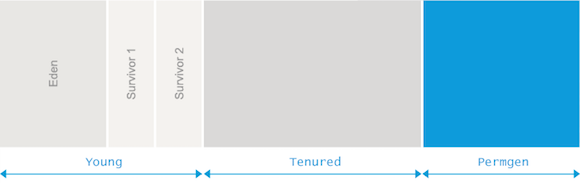
Running with: [-Xms2g, -Xmx2g, -XX:+UseParallelGC, -XX:+PrintGCDetails]
Runtime.getRuntime().maxMemory(): 2,010,112K.

... rest of the GC log skipped for brevity ...

 PSYoungGen      total 611840K, used 524800K [0x0000000795580000, 0x00000007c0000000, 0x00000007c0000000)
  eden space 524800K, 100% used [0x0000000795580000,0x00000007b5600000,0x00000007b5600000)
  from space 87040K, 0% used [0x00000007bab00000,0x00000007bab00000,0x00000007c0000000)
  to   space 87040K, 0% used [0x00000007b5600000,0x00000007b5600000,0x00000007bab00000)
 ParOldGen       total 1398272K, used 1394966K [0x0000000740000000, 0x0000000795580000, 0x0000000795580000)
from which you can see that the Eden space is set to 524,800K, both survivor spaces (from and to) are set to 87,040K and Old space is sized at 1,398,272K. Adding together Eden, Old and one of the survivor spaces totals exactly to 2,010,112K, confirming that the missing 85M or 87,040K was indeed the remaining Survivor space.
Summary
After reading the post you are now equipped with new insight into Java API implementation details. The next time certain tooling visualizes the total available heap size to be slightly less than the Xmx-specified heap size, you know the difference to be equal to the size of one of your Survivor spaces.
I have to admit the fact is not particularly useful in day to day programming activities, but this was not the point for the post. Instead I wrote the post describing a particular characteristic I am always looking in good engineers – curiosity. Good engineers are always looking to understand how and why something works the way it does. Sometimes the answer remains hidden, but I still recommend you to attempt to seek answers. Eventually the knowledge built along the way will start paying out dividends.
| Reference: | Why is my JVM having access to less memory than specified via -Xmx? from our JCG partner Nikita Salnikov Tarnovski at the Plumbr Blog blog. |
