 This post was written by Steve Hannah, one of the newest additions to the Codename One team and a long time community contributor.
The upcoming update to Codename One will include a new package (com.codename1.charts) for rendering charts in your applications. This includes models and renderers for many common classes of charts including many flavours of bar charts, line charts, scatter charts, and pie charts.
Goals
For the charts package, we wanted to enable Codename One developers to add charts and visualizations to their apps without having to include external libraries or embedding web views. We also wanted to harness the new features in the graphics pipeline to maximize performance.
Differences from CN1aChartEngine
This package is based on the existing CN1aChartEngine library, but has been refactored substantially to reduce its size, improve its performance, and simplify its API. If you have used the existing CN1aChartEngine library, much of the API (e.g. models and renderers) will be familiar. The key differences are:
- API. It includes ChartComponent, a first-class Codename One Component that can be included anywhere inside your forms. CN1aChartEngine used a number of Android-like abstractions (e.g. View, Intent, and Activity) to simplify the porting process from the original Android library. While this indeed made it easier to port, it made the API a little bit confusing for Codename One development.
- Performance. It uses the built-in Codename One graphics pipeline for rendering all graphics. CN1aChartEngine used the CN1Pisces library for rendering graphics, which is an order of magnitude slower than the built-in pipeline. This was for historical reasons. When CN1aChartEngine was first developed, the built-in pipeline was missing some features necessary to implement charts.
Note: Actually, just before refactoring CN1aChartEngine to produce the charts package, I ported it over to use the built-in pipeline. If you are already using CN1aChartEngine in your app, and want to benefit from the improved performance without having to change your code, you can update to that version.
Device Support
Since the charts package makes use of 2D transformations and shapes, it requires some of the new graphics features that are not yet available on all platforms. Currently the following platforms are supported:
- Simulator
- Android
- iOS
If you require support for other platforms, you may want to use the CN1aChartEngine library instead.
Features
- Built-in support for many common types of charts including bar charts, line charts, stacked charts, scatter charts, pie charts and more.
- Pinch Zoom – The ChartComponent class includes optional pinch zoom support.
- Panning Support – The ChartComponent class includes optional support for panning.
Chart Types
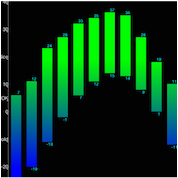
The com.codename1.charts package includes models and renderers for many different types of charts. It is also extensible so that you can add your own chart types if required. The following screen shots demonstrate a small sampling of the types of charts that can be created.
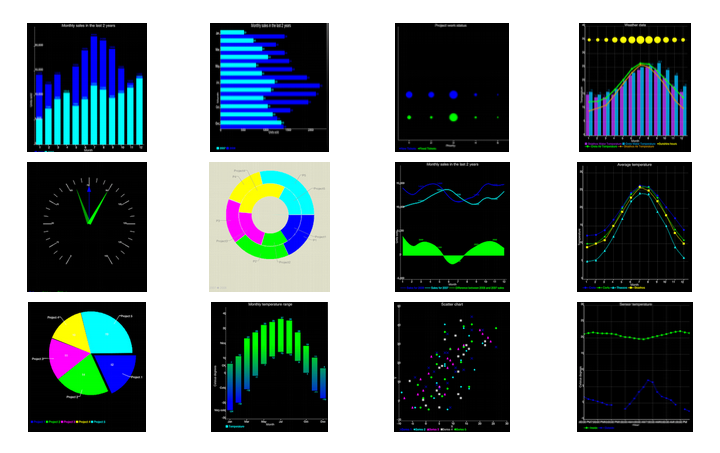
Note: The above screenshots were taken from the ChartsDemo app. You can start playing with this app now by checking it out from our subversion repository.
How to Create A Chart
Adding a chart to your app involves four steps:
- Build the model. You can construct a model (aka data set) for the chart using one of the existing model classes in the com.codename1.charts.models package. Essentially, this is just where you add the data that you want to display.
- Set up a renderer. You can create a renderer for your chart using one of the existing renderer classes in the com.codename1.charts.renderers package. The renderer allows you to specify how the chart should look. E.g. the colors, fonts, styles, to use.
- Create the Chart View. Use one of the existing view classes in the com.codename1.charts.views package.
- Create a ChartComponent. In order to add your chart to the UI, you need to wrap it in a ChartComponent object.
You can check out the ChartsDemo app for specific examples, but here is a high level view of some code that creates a Pie Chart.
    /**
     * Creates a renderer for the specified colors.
     */
    private DefaultRenderer buildCategoryRenderer(int[] colors) {
        DefaultRenderer renderer = new DefaultRenderer();
        renderer.setLabelsTextSize(15);
        renderer.setLegendTextSize(15);
        renderer.setMargins(new int[]{20, 30, 15, 0});
        for (int color : colors) {
            SimpleSeriesRenderer r = new SimpleSeriesRenderer();
            r.setColor(color);
            renderer.addSeriesRenderer(r);
        }
        return renderer;
    }

    /**
     * Builds a category series using the provided values.
     *
     * @param titles the series titles
     * @param values the values
     * @return the category series
     */
    protected CategorySeries buildCategoryDataset(String title, double[] values) {
        CategorySeries series = new CategorySeries(title);
        int k = 0;
        for (double value : values) {
            series.add("Project " + ++k, value);
        }

        return series;
    }

    public Form createPieChartForm() {

        // Generate the values
        double[] values = new double[]{12, 14, 11, 10, 19};

        // Set up the renderer
        int[] colors = new int[]{ColorUtil.BLUE, ColorUtil.GREEN, ColorUtil.MAGENTA, ColorUtil.YELLOW, ColorUtil.CYAN};
        DefaultRenderer renderer = buildCategoryRenderer(colors);
        renderer.setZoomButtonsVisible(true);
        renderer.setZoomEnabled(true);
        renderer.setChartTitleTextSize(20);
        renderer.setDisplayValues(true);
        renderer.setShowLabels(true);
        SimpleSeriesRenderer r = renderer.getSeriesRendererAt(0);
        r.setGradientEnabled(true);
        r.setGradientStart(0, ColorUtil.BLUE);
        r.setGradientStop(0, ColorUtil.GREEN);
        r.setHighlighted(true);

        // Create the chart ... pass the values and renderer to the chart object.
        PieChart chart = new PieChart(buildCategoryDataset("Project budget", values), renderer);

        // Wrap the chart in a Component so we can add it to a form
        ChartComponent c = new ChartComponent(chart);

        // Create a form and show it.
        Form f = new Form("Budget");
        f.setLayout(new BorderLayout());
        f.addComponent(BorderLayout.CENTER, c);
        return f;
}| Reference: | Codename One Charts from our JCG partner Shai Almog at the Codename One blog. |
