There are several ways to improve your product. One such way is to carefully track what your users are experiencing and improve based on that. We do apply this technique ourselves and have again spent some time looking at different data
Besides many other aspects we were after, we also posed a question “what is the worst-case effect for latency GC is triggering for an application”. To answer the question we analyzed the data from 312 different JVMs attaching Plumbr Agent during the past two months. The results were interesting and we decided to share the outcome with you:
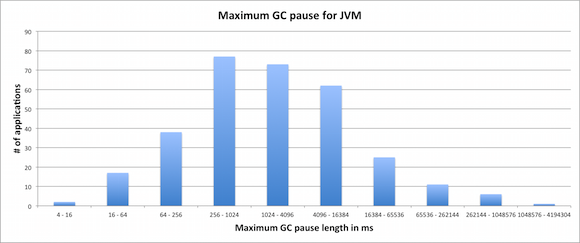
On the X-axis there is the maximum length of the pause within this JVM, grouped into buckets. On the Y-axis there is the number of applications with maximum pause falling into a particular bucket. Using the data above, we can for example claim the following about the 312 JVMs being monitored:
- 57 JVMs (18%) managed to keep GC pauses at bay with maximum pause under 256ms
- 73 JVMs (23%) faced a maximum GC pause in between 1024ms and 4095ms
- 105 JVMs (33%) stopped the application threads for 4 or more seconds due to GC.
- 43 JVMs (14%) faced a maximum GC pause longer than 16 seconds
- 18 JVMs (6%) contained a GC pause spanning for more than a minute
- Current record holder managed to stop all application threads for more than 16 minutes due to a garbage collection pause.
We do admit that our data might be biased in regard that – the JVMs Plumbr ends up monitoring are more likely to suffer from performance issues triggering longer GC pauses. So there is a grain of salt you have to take these results with, but overall, the discoveries are still interesting. After all, tens of added seconds to the latency cannot be considered tolerable for majority of the applications out there.
We have several hypotheses why the situation looks as bad as it currently does:
- In first case, engineers are not even aware that their application is performing so badly. Having no access to GC logs and being isolated from the customer support might completely hide the problem from the people who could be able to improve the situation
- Second case consists of people is struggling to reproduce the problem. As always, first step towards having a solution is building a reproducible test case in an environment where further experiments can be concluded. When the long-lasting GC pauses only occur in production environments, then coming up with a solution is a daunting task.
- Third group of the issues falls on the shoulders of engineers who are aware of the issue and can even reproduce the behaviour at will, but have no clues how to actually improve the situation. Tuning GC is a tricky task and requires a lot of knowledge about JVM internals, so most engineers in this situation find themselves in between a rock and a hard place.
The good news is that we are working hard on making all those reasons obsolete – Plumbr surfaces the poorly-behaving GC issues, alerts you when these issues are detected and better yet, gives you a tailor-made solutions how to improve the behaviour. So instead of weeks of trial-and-error you are now able to surface and solve those cases in minutes.
| Reference: | Revealing the length of Garbage Collection pauses from our JCG partner Nikita Artyushov at the Plumbr Blog blog. |
