This post is part of our open culture – we continue sharing insights from our day-to-day work. This time we take a peek at the very core of our value proposition, namely – looking for the answer to these questions:
- How often do memory leaks occur in Java applications?
- How big is a memory leak?
- How quickly does a memory leak grow?
If you stay with me for the next couple of minutes, I will open up the answers one by one, based on the data gathered by Plumbr memory leak detector agents throughout the last ~six months.
First and foremost, the analysis is based on 2,180 different applications running with Plumbr Agents. The definition of a “different application” is somewhat tricky and I spare you the mundane details, but we did our best to identify a unique JVM based on the data available.
In these 2,180 applications Plumbr found 754 different heap memory leaks. As some applications contained several memory leaks, the number of unique applications where a leak was detected was a bit lower – 682 to be precise. Based on this data, we can conclude that 31% of the Java applications contain a heap memory leak. Take this with a grain of salt – we do admit the fact that the applications Plumbr ends up monitoring are more likely to contain a memory leak than the ones we do not monitor.
Now, knowing that you have roughly one in three chances of having a heap memory leak in your application, lets see whether you should be worried about the leaks at all. For this, lets look at two different characteristics we have for these 754 heap memory leaks.
Memory leak size
When Plumbr finds a memory leak, it runs a complex calculation to determine the retained size of the leak. Or, in more simpler way – Plumbr calculates how big is the particular leak in megabytes. This data is visible in the following chart:
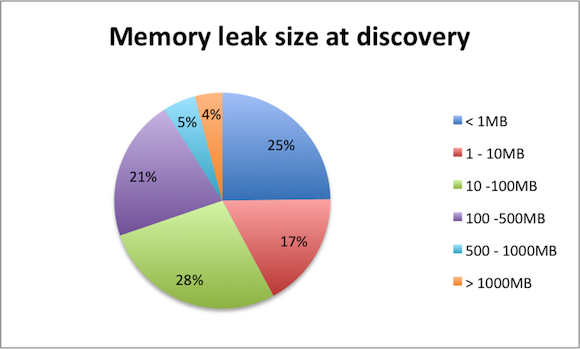
From the data we can see that Plumbr detects many leaks at their infancy – for example it has found 187 leaks (25% of total leaks) while the leak was still smaller than 1MB at the time of discovery. In the other extreme, some leaks take longer to detect, so in 31 cases the leak was detected only after it had grown to 1GB. The biggest leaks had managed to escalate to 3GB in size before detection.
Another interesting conclusion to draw from the above is that majority of the leaks get caught by Plumbr before the application’s end users feel any impact – 70% of the leaks are still smaller than 100MB at the time Plumbr reports the leak as an incident.
Memory leak velocity
Now, the fact that an application contains a leak occupying less than 100MB is not something to take action upon. Coupling the size of the leak with the velocity of the leak, the severity of the incident becomes more clear:
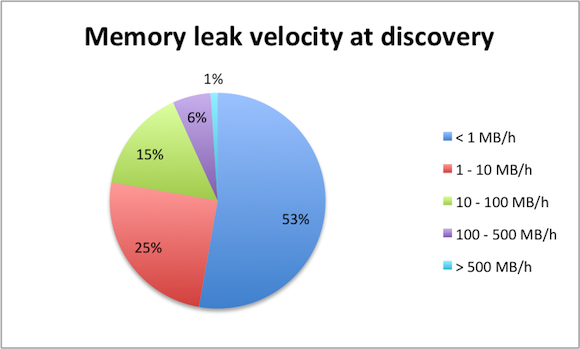
The information on the above chart can be interpreted this way: for 6% (37 occurrences) of the cases the leak velocity at the time of discovery was between 100 and 500 MB/hour.
In the extreme cases, we have either very slow or extremely fast leaks. On 398 occasions (53% of the leaks discovered) the leak was escalating at the pace of 1MB per hour or less. At the other end of the spectrum we had 31 leaks escalating at mind-boggling 1GB/hour or faster. The “record holder” in this regard managed to leak more than 3GB per hour.
Coupling velocity information with current leak size and maximum heap available to your application, you can estimate the amount of time the particular application has left before crashing with the OutOfMemoryError.
One specific example from last Friday: Plumbr reported an incident where the leak size was 120MB. The velocity of the leak was a modest 160MB/day. Linking this information with the current heap usage and maximal heap available, we could predict that the particular JVM would be dead by Tuesday 2PM. We were wrong by six hours, which, if taking into account that the application usage patterns tend to change over time is part of the prediction game, is close enough a prediction.
| Reference: | Memory leaks – measuring frequency and severity from our JCG partner Sergei Mihhailov at the Plumbr Blog blog. |
