During all the troubleshooting exercises I have carried out in my career, I have picked up a feeling that the bugs I am after are evolving and becoming meaner and uglier over time. Or maybe it is just my age kicking in. This particular Heisenbug – lookalike this post is about has again kept me awake for more than I would actually have liked to.
As other particularly nasty bugs, the one I was now after surfaced with a symptom that “sometimes the system is slow”. Great, I already felt the shivers going down my spine. Things got a bit better when I discovered that the system had a simple monitoring solution set up in production, monitoring the system. Essentially it was not much more than Pingdom, measuring the response time once a second, but the latency graphs immediately caught my eye.
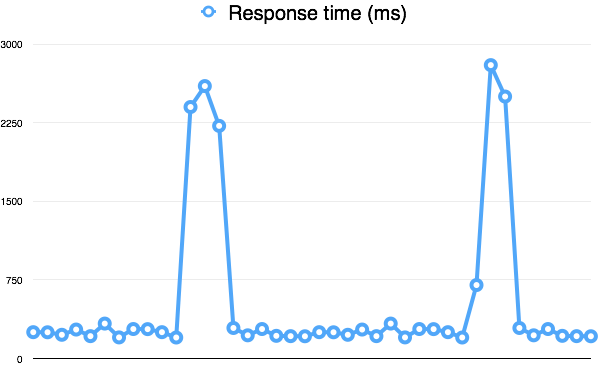
There were seemingly random spikes in response times plotted in the graphs – every once in a blue moon the responses started to take almost 10x more time to compose. And within a short while everything was back to normal again.
First suspects – regular cron jobs or expensive reporting processes were nowhere in sight. Neither was the storage monitoring exposing any particularly ugly queries hitting the databases. But before calling it a night, I added some more logging options to the application configuration, rebooted the whole stuff and went to bed puzzled about the behaviour.
Next morning I had something extra to look at, GC logs among the other things. Within ten minutes I found myself staring at something like the following:
11.408: [Full GC [PSYoungGen: 192K->0K(48640K)] [ParOldGen: 16324K->14750K(114688K)] 16516K->14750K(163328K) [PSPermGen: 31995K->31637K(64000K)], 0.1543430 secs] [Times: user=0.58 sys=0.00, real=0.16 secs]
...
3613.362: [Full GC [PSYoungGen: 256K->0K(47104K)] [ParOldGen: 15142K->13497K(114688K)] 15398K->13497K(161792K) [PSPermGen: 32429K->32369K(72192K)], 0.1129070 secs] [Times: user=0.51 sys=0.00, real=0.11 secs]
...
7215.278: [Full GC [PSYoungGen: 224K->0K(44544K)] [ParOldGen: 13665K->13439K(114688K)] 13889K->13439K(159232K) [PSPermGen: 32426K->32423K(70144K)], 0.0881450 secs] [Times: user=0.44 sys=0.00, real=0.09 secs]
...
I could now correlate the seemingly random performance degradation to the Full GC running each time around 3,600 seconds has passed. Attaching VisualVM to the JVM left me puzzled – there was no evidence of high memory usage which should be causing the full garbage collector to run. Checking with the developers I made sure they were not running explicit GCs via cron jobs. So there i stood, confused by the regularity of the GC.
What does an engineer do when he is puzzled by a question? He googles. And there it was, staring right into my face. Pages after pages with people who are concerned about the hourly Full GC taking place without any apparent reason.
And the culprit – RMI. Apparently when your application either exposes its services via RMI or consumes any services over RMI, you are bound to have an additional garbage collection cycle. As the RMI documentation says:
“When it is necessary to ensure that unreachable remote objects are unexported and garbage collected in a timely fashion, the value of this property represents the maximum interval (in milliseconds) that the Java RMI runtime will allow between garbage collections of the local heap. The default value is 3600000 milliseconds (one hour).”
Solution for the time being was increasing the sun.rmi.dgc.server.gcInterval length from the default 3,600 seconds. I wonder how things used to look prior to the change introduced in JDK 6, when RMI used to force a full GC once a minute. Considering all the EJB frenzy back then, I guess none of the apps even stood a chance performance-wise. If you have memories from the ancient times, maybe you can shed some light upon how the apps were able to survive this madness.
