GC Memory Visualizer Tutorial – Part1
As you may have read from past articles, one of the key Java programmer skills to acquire is your ability to understand and assess the health of the JVM such as the Java heap memory footprint along with the garbage collection process.
In order to achieve the above goals, all JVM vendors (Oracle, IBM…) provide, via the verbose:gc parameter, a way to generate and log the runtime JVM & GC activity. That being said, this does not mean that you will have to analyze raw GC data forever. Monitoring and log analyzer tools have emerged over the past years allowing us to better “visualize” the complexity of the JVM runtime processing.
This article is the first of a series that provides you with a tutorial on how to get started and take advantage of the IBM Garbage Collection and Memory Visualizer. Future articles will cover in more detail the different GCMV features via examples and problem simulations.
JVM fundamentals
If you are not familiar with the JVM principles and the different naming conventions, I first recommend that you go through the articles below. Improving your Java and JVM troubleshooting skills is like building a house: build a solid foundation and structure first before focussing on the finishing work.
- ## Sun HotSpot VM
- ## IBM VM
- ## Oracle JRockit VM
- ## Sun (Oracle) – Java memory management white paper
- ## OpenJDK – Open-source Java implementation
GC and Memory Visualizer – Tool overview
GCMV is essentially a free tool, developed by IBM, which allows you to “visualize” and analyse the JVM memory usage and garbage collection activity of your Java application(s). Its reporting and data visualisation features are extremely useful to understand the Java heap memory footprint trend of your application over time and can help detect problems such as memory leaks.
Such capabilities are achieved due to the tool’s ability to parse and interpret many types of GC logs (Oracle HotSpot, IBM JVM, native memory log etc.). Finally, GCMV also provides out-of-the-box recommendations via its internal statistical engine.
GCMV is best used in conjunction with a comprehensive capacity planning strategy so please continue to do your due diligence from that perspective.
The rest of the article will now focus on how getting started quickly with GCMV.
Step 1 – Download IBM Support Assistant
First, you will need to download and install IBM Support Assistant (GCMV is installed within the IBM Support Assistant Workbench).
Step 2 – Add GCMV as a new add-on
Once you have installed ISA, you will need to download GCMV as an ISA add-on as per the following steps:
- From the ISA main screen, select Launch Activity > Analyze Problem.
- Now select the link Find New Tools Add-ons.
- Expand JVM-based Tools, select and install IBM Monitoring and Diagnostics Tools for Java – Garbage Collection and Memory Visualizer for ISA.
- You should now see GCMV under the ISA Tools Catalog section.
Step 3 – Load and visualize your first JVM GC log sample
You are now ready to load and analyze your first GC log using GCMV!
- Under Tools Catalog, double click on GCMV.
- Now browse through your computer and select the desired GC log. The parsing and analysis process will now begin…
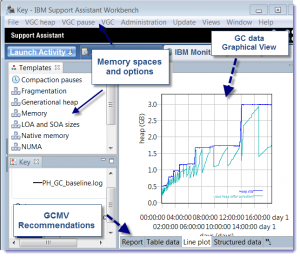
- Once the parsing process is completed, you will see a graphical view of the GC data along with many other options.
- The utilization of the different Java heap memory spaces can be found on the left side. The GCMV recommendations can be found under the graph via the Report tab.
* NOTE: instructions on how to obtain the verbose:gc logs from your JVM runtime environment can be found here.
I hope you enjoyed this short tutorial on how getting started with the IBM GCMV tool. The next article will cover in more detail a few classic JVM problem patterns such as memory leaks. In the meantime, I recommend that you load any GC log you may have from your application and start to get familiar with the different features of GCMV. Please feel free to comment or ask any question.


Nice aricle, Waiting on the next post in this seris?
I have loaded samples from two different servers, but the tuning recommendation is missing on one of the sample, and I am unable to find any button to enable it. Am I missing something here?
Hi WASUser and thanks for your comments,
I will release the part #2 to JCG in about one week. It will includes real life scenarios like analyzing a true tenured space memory leak using GCMV.
For your situation, it is possible that the log sample did not contain enough data for GCMV to come up with recommendations. Please try to capture more data the next time and see if you get better results.
Thanks.
P-H
Waiting on Part2 .