Before demonstrating the JavaFX 2.0 chart APIs, this first code listing shows the configuration of data to be used in the examples. In a more realistic scenario, I’d get this data from a data store, but in this case I simply include in directly in the source code for convenient access for the example. Although this code is not itself inherently related to the JavaFX 2.0 charting, there are some interesting things about it. The code makes use of Java 7’s underscores in numeric literals to make it easier to read the land size and populations of the sample states used in the data. The code listing also uses Guava‘s ImmutableMap class (covered in a previous post).
Code that Configures the Sample Data
/** Simple U.S. state representation. */
   private enum State
   {
      ALASKA("Alaska"),
      CALIFORNIA("California"),
      COLORADO("Colorado"),
      NEW_YORK("New York"),
      RHODE_ISLAND("Rhode Island"),
      TEXAS("Texas"),
      WYOMING("Wyoming");

      private String stateName;

      State(final String newStateName)
      {
         this.stateName = newStateName;
      }
   }

   /** Simple Movie representation. */
   private enum Movie
   {
      STAR_WARS("Star Wars"),
      EMPIRE_STRIKES_BACK("The Empire Strikes Back"),
      RAIDERS_OF_THE_LOST_ARK("Raiders of the Lost Ark"),
      INCEPTION("Inception"),
      CHRISTMAS_VACATION("Christmas Vacation"),
      CHRISTMAS_VACATION_2("Christmas Vacation 2"),
      FLETCH("Fletch");

      private String movieName;

      Movie(final String newMovieName)
      {
         this.movieName = newMovieName;
      }
   }

   /** Mapping of state name to area of state measured in kilometers. */
   private final static Map<String, Long> statesLandSizeKm;

   /** Mapping of state name to estimated number of people living in that state. */
   private final static Map<String, Long> statesPopulation;

   /** Normal audience movie ratings on Rotten Tomatoes. */
   private final static Map<String, Double> movieRatingsNormal;

   /** Critics movie ratings on Rotten Tomatoes. */
   private final static Map<String, Double> movieRatingsCritics;

   /** Dustin's movie ratings. */
   private final static Map<String, Double> movieRatingsDustin;

   /** Maximum population to be shown on bar charts of states' populations.  */
   private final static long POPULATION_RANGE_MAXIMUM = 40_000_000L;

   /** Maximum land area (km) to be shown on bar charts of states' land areas. */
   private final static long LAND_AREA_KM_MAXIMUM = 1_800_000L;

   /** Maximum movie rating to be shown on bar charts. */
   private final static double MOVIE_RATING_MAXIMUM = 10.0;

   /** Width of chart. */
   private final static int CHART_WIDTH = 750;

   /** Height of chart. */
   private final static int CHART_HEIGHT = 600;

   /** Width of chart for Movie Ratings. */
   private final static int MOVIE_CHART_WIDTH = CHART_WIDTH + 350;

   /* Initialize final static variables. */
   static
   {
      statesLandSizeKm =
         ImmutableMap.<String, Long>builder()
                     .put(State.ALASKA.stateName, 1_717_854L)
                     .put(State.CALIFORNIA.stateName, 423_970L)
                     .put(State.COLORADO.stateName, 269_601L)
                     .put(State.NEW_YORK.stateName, 141_299L)
                     .put(State.RHODE_ISLAND.stateName, 4_002L)
                     .put(State.TEXAS.stateName, 695_621L)
                     .put(State.WYOMING.stateName, 253_336L)
                     .build();

      statesPopulation =
         ImmutableMap.<String, Long>builder()
                     .put(State.ALASKA.stateName, 722_718L)
                     .put(State.CALIFORNIA.stateName, 37_691_912L)
                     .put(State.COLORADO.stateName, 5_116_769L)
                     .put(State.NEW_YORK.stateName, 19_465_197L)
                     .put(State.RHODE_ISLAND.stateName, 1_051_302L)
                     .put(State.TEXAS.stateName, 25_674_681L)
                     .put(State.WYOMING.stateName, 568_158L)
                     .build();

      movieRatingsNormal =
         ImmutableMap.<String, Double>builder()
                     .put(Movie.CHRISTMAS_VACATION.movieName, 8.3)
                     .put(Movie.CHRISTMAS_VACATION_2.movieName, 1.3)
                     .put(Movie.STAR_WARS.movieName, 9.3)
                     .put(Movie.EMPIRE_STRIKES_BACK.movieName, 9.4)
                     .put(Movie.RAIDERS_OF_THE_LOST_ARK.movieName, 9.3)
                     .put(Movie.INCEPTION.movieName, 9.3)
                     .put(Movie.FLETCH.movieName, 7.8)
                     .build();

      movieRatingsCritics =
         ImmutableMap.<String, Double>builder()
                     .put(Movie.CHRISTMAS_VACATION.movieName, 6.3)
                     .put(Movie.CHRISTMAS_VACATION_2.movieName, 0.0)
                     .put(Movie.STAR_WARS.movieName, 9.4)
                     .put(Movie.EMPIRE_STRIKES_BACK.movieName, 9.7)
                     .put(Movie.RAIDERS_OF_THE_LOST_ARK.movieName, 9.4)
                     .put(Movie.INCEPTION.movieName, 8.6)
                     .put(Movie.FLETCH.movieName, 7.5)
                     .build();
      movieRatingsDustin =
         ImmutableMap.<String, Double>builder()
                     .put(Movie.CHRISTMAS_VACATION.movieName, 7.0)
                     .put(Movie.CHRISTMAS_VACATION_2.movieName, 0.0)
                     .put(Movie.STAR_WARS.movieName, 9.5)
                     .put(Movie.EMPIRE_STRIKES_BACK.movieName, 10.0)
                     .put(Movie.RAIDERS_OF_THE_LOST_ARK.movieName, 10.0)
                     .put(Movie.INCEPTION.movieName, 9.0)
                     .put(Movie.FLETCH.movieName, 9.0)
                     .build();
   }
The next code listing demonstrates the boot-strapping of the sample application. This includes the one-line main function that normally kicks off Java applications and the more interesting start(String[]) method that is overridden from the extended Application class. This code listing also makes use of Java 7’s switch-on-Strings capability for a quick-and-dirty implementation of command-line argument parsing to run a particular chart generation demonstration. The example demonstrates that command-line arguments passed to Application.launch(String…) are available to the JavaFX application via the Application.getParameters() method that returns an instance of nested Application.Parameters.
Code that Launches JavaFX 2.0 Charting Demonstration Example
/**
    * Start JavaFX application.
    *
    * @param stage First stage of JavaFX application.
    * @throws Exception
    */
   @Override
   public void start(final Stage stage) throws Exception
   {
      final Parameters parameters = getParameters();  // command-line args
      final List<String> args = parameters.getUnnamed();
      final String firstArgument = !args.isEmpty() ? args.get(0) : "1";
      final int chartWidth = !firstArgument.equals("4") ? CHART_WIDTH : MOVIE_CHART_WIDTH;

      stage.setTitle("Building Bar Charts");
      final Group rootGroup = new Group();
      final Scene scene = new Scene(rootGroup, chartWidth, CHART_HEIGHT, Color.WHITE);
      stage.setScene(scene);

      switch (firstArgument)
      {
         case "1" :
            rootGroup.getChildren().add(buildVerticalLandAreaBarChart());
            break;
         case "2" :
            rootGroup.getChildren().add(buildVerticalPopulationBarChart());
            break;
         case "3" :
            rootGroup.getChildren().add(buildHorizontalPopulationBarChart());
            break;
         case "4" :
            rootGroup.getChildren().add(buildVerticalMovieRatingsBarChart());
            break;
         case "5" :
            rootGroup.getChildren().add(buildStatesLandSizePopulationScatterChart());
            break;
         default :
            rootGroup.getChildren().add(buildVerticalLandAreaBarChart());
      }
      stage.show();
   }

   /**
    * Main function for demonstrating JavaFX 2.0 bar chart and scatter chart.
    *
    * @param arguments Command-line arguments: none expected.
    */
   public static void main(final String[] arguments)
   {
      Application.launch(arguments);
   }
With the data to populate the charts configured and the basic JavaFX application boot-strapping demonstrated, it’s time to start looking at use of the actual JavaFX 2.0 chart APIs. As the code above shows, the first option (“1”) leads to generation of a vertical bar chart depicting the sample states’ relative land areas in kilometers. The methods executed for that example are shown next.
Generating Vertical Bar Chart with States’ Land Areas
/**
    * Build ObservableList of XYChart.Series instances mapping state names to
    * land areas.
    *
    * @return ObservableList of XYChart.Series instances mapping state names to
    *    land areas.
    */
   public ObservableList<XYChart.Series<String,Long>> buildStatesToLandArea()
   {
      final ObservableList<XYChart.Data<String,Long>> statesToLandArea =
         FXCollections.observableArrayList();
      for (final State state : State.values())
      {
         final XYChart.Data<String,Long> stateAreaData =
            new XYChart.Data<String,Long>(
               state.stateName, statesLandSizeKm.get(state.stateName));
         statesToLandArea.add(stateAreaData);
      }
      final XYChart.Series<String, Long> landSeries =
         new XYChart.Series<String, Long>(statesToLandArea);
      final ObservableList<XYChart.Series<String, Long>> series =
         FXCollections.observableArrayList();
      landSeries.setName("State Land Size (km)");
      series.add(landSeries);
      return series;
   }

   /**
    * Provides a CategoryAxis instantiated with sample states' names.
    *
    * @return CategoryAxis with sample states' names.
    */
   public CategoryAxis buildStatesNamesCategoriesAxis()
   {
      final ObservableList<String> stateNames = FXCollections.observableArrayList();
      stateNames.addAll(
         State.ALASKA.stateName,
         State.CALIFORNIA.stateName,
         State.COLORADO.stateName,
         State.NEW_YORK.stateName,
         State.RHODE_ISLAND.stateName,
         State.TEXAS.stateName,
         State.WYOMING.stateName);
      final CategoryAxis categoryAxis = new CategoryAxis(stateNames);
      categoryAxis.setLabel("State");
      categoryAxis.setMinWidth(CHART_WIDTH);
      return categoryAxis;
   }

   /**
    * Build vertical bar chart comparing land areas of sample states.
    *
    * @return Vertical bar chart comparing land areas of sample states.
    */
   public XYChart buildVerticalLandAreaBarChart()
   {
      final ValueAxis landAreaAxis = new NumberAxis(0, LAND_AREA_KM_MAXIMUM, 50_000);
      final BarChart landAreaBarChart =
         new BarChart(buildStatesNamesCategoriesAxis(), landAreaAxis, buildStatesToLandArea());
      landAreaBarChart.setMinWidth(CHART_WIDTH);
      landAreaBarChart.setMinHeight(CHART_HEIGHT);
      landAreaBarChart.setTitle("Land Area (in km) of Select U.S. States");
      return landAreaBarChart;
   }
The above snippet of code shows the three methods I used to generate a bar chart. The method at the bottom, buildVerticalLandAreaBarChart(), instantiates a NumberAxis for the chart’s y-axis and uses that implementation of ValueAxis in instantiating a BarChart. The BarChart instantiation invokes the other two methods in the code snippet to create the x-axis with states’ names and to prepare the data in ObservableList<XYChart.Series<String,Long>> format to be used in the chart generation. The generated chart is shown next.

Similar code can lead to a similar chart for depicting populations of the sample states. The code for doing this is shown next and is followed by the screen snapshot of the generated chart.
Generating Vertical Bar Chart with States’ Populations
// method buildStatesNamesCategoriesAxis() was shown in previous code listing

   /**
    * Build one or more series of XYChart Data representing state names as 'x'
    * portion and state populations as 'y' portion. This method is likely to be
    * used in vertical presentations where state names are desired on the x-axis
    * and population numbers are desired on the y-axis.
    *
    * @return Series of XYChar Data representing state names as 'x' portion and
    *    state populations as 'y' portion.
    */
   public ObservableList<XYChart.Series<String,Long>> buildStatesToPopulation()
   {
      final ObservableList<XYChart.Data<String,Long>> statesToPopulation =
         FXCollections.observableArrayList();
      for (final State state : State.values())
      {
         final XYChart.Data<String,Long> statePopulationData =
            new XYChart.Data<String,Long>(
               state.stateName, statesPopulation.get(state.stateName));
         statesToPopulation.add(statePopulationData);
      }
      final XYChart.Series<String, Long> populationSeries =
         new XYChart.Series<String, Long>(statesToPopulation);
      final ObservableList<XYChart.Series<String, Long>> series =
         FXCollections.observableArrayList();
      populationSeries.setName("State Population");
      series.add(populationSeries);
      return series;
   }

   /**
    * Build vertical bar chart comparing populations of sample states.
    *
    * @return Vertical bar chart comparing populations of sample states.
    */
   public XYChart buildVerticalPopulationBarChart()
   {
      final ValueAxis populationAxis = new NumberAxis(0, POPULATION_RANGE_MAXIMUM, 2_000_000);
      final BarChart populationBarChart =
         new BarChart(buildStatesNamesCategoriesAxis(), populationAxis, buildStatesToPopulation());
      populationBarChart.setMinWidth(CHART_WIDTH);
      populationBarChart.setMinHeight(CHART_HEIGHT);
      populationBarChart.setTitle("Population of Select U.S. States");
      return populationBarChart;
   }
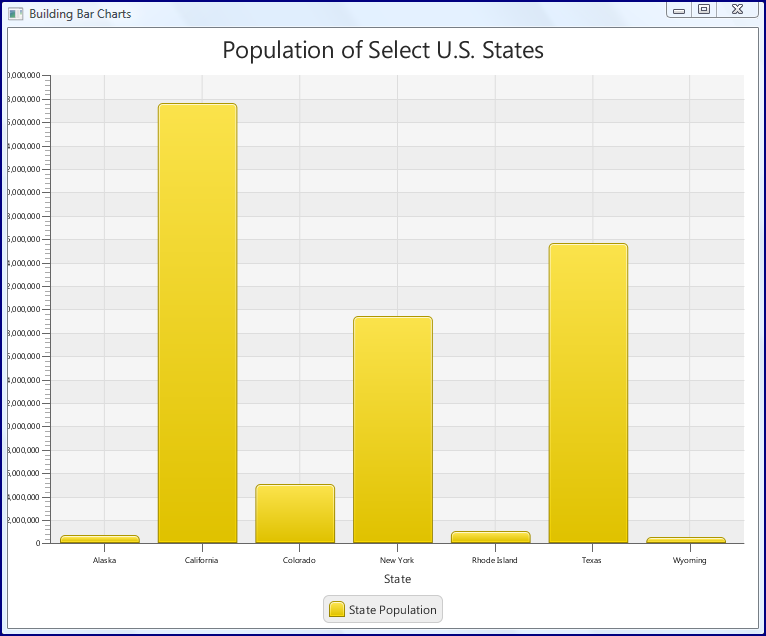
The previous two diagrams were vertical diagrams. The next example uses the same population of the states for its sample data as used in the last example, but depicts it with a horizontal bar chart rather than with the vertical chart. Note that the same method is used for generating the axis with states’ names as in the last two examples, but its result is passed in as the second argument to the BarChart constructor rather than as the first argument. This change of order to the BarChart constructor changes the chart from vertical to horizontal. In other words, having a CategoryAxis as the first argument and a ValueAxis as the second argument to the BarChart constructor leads to a vertical chart. Switching the order of those two types of Axis leads to a horizontal chart. I also had to switch the order of the mapping of the data being charted so that the key portion was the population and the value portion was the state names. The code is followed by the output.
Generating Horizontal Bar Chart with States’ Populations
// method buildStatesNamesCategoriesAxis() was shown in previous code listings

   /**
    * Build one or more series of XYChart Data representing population as 'x'
    * portion and state names as 'y' portion. This method is likely to be used
    * in horizontal presentations where state names are desired on the y-axis
    * and population numbers are desired on the x-axis.
    *
    * @return Series of XYChar Data representing population as 'x' portion and
    *    state names as 'y' portion.
    */
   public ObservableList<XYChart.Series<Long,String>> buildPopulationToStates()
   {
      final ObservableList<XYChart.Data<Long,String>> statesToPopulation =
         FXCollections.observableArrayList();
      for (final State state : State.values())
      {
         final XYChart.Data<Long,String> statePopulationData =
            new XYChart.Data<Long,String>(
               statesPopulation.get(state.stateName), state.stateName);
         statesToPopulation.add(statePopulationData);
      }
      final XYChart.Series<Long, String> populationSeries =
         new XYChart.Series<Long, String>(statesToPopulation);
      final ObservableList<XYChart.Series<Long, String>> series =
         FXCollections.observableArrayList();
      populationSeries.setName("State Population");
      series.add(populationSeries);
      return series;
   }

   /**
    * Build horizontal bar chart comparing populations of sample states.
    *
    * @return Horizontal bar chart comparing populations of sample states.
    */
   public XYChart buildHorizontalPopulationBarChart()
   {
      final ValueAxis populationAxis = new NumberAxis(0, POPULATION_RANGE_MAXIMUM, 2_000_000);
      final BarChart populationBarChart =
         new BarChart(populationAxis, buildStatesNamesCategoriesAxis(), buildPopulationToStates());
      populationBarChart.setMinWidth(CHART_WIDTH);
      populationBarChart.setTitle("Population of Select U.S. States");
      return populationBarChart;
   }

For all of these examples of generating a bar chart, I’ve made use of JavaFX’s XYChart. It turns out that ScatterChart also extends XYChart, so its use is similar to that of BarChart. The big difference in this case (ScatterChart) is that two values-oriented axes will exist. In other words, instead of using states’ names for the x-axis (vertical) or for the y-axis (horizontal), each axis will be based on values (land area for x-axis and population for y-axis). These types of charts are often used to visually determine degree of correlation between the data. The code for generating this and the output it generates are shown next.
Generating Scatter Chart of State Population to State Land Size
/**
    * Build mapping of land area to population for each state.
    *
    * @return Mapping of land area to population for each sample state.
    */
   public ObservableList<XYChart.Series<Long,Long>> buildAreaToPopulation()
   {
      final ObservableList<XYChart.Data<Long,Long>> areaToPopulation =
         FXCollections.observableArrayList();
      for (final State state : State.values())
      {
         final XYChart.Data<Long,Long> areaPopulationData =
            new XYChart.Data<Long,Long>(
               statesLandSizeKm.get(state.stateName),
               statesPopulation.get(state.stateName));
         areaToPopulation.add(areaPopulationData);
      }
      final XYChart.Series<Long, Long> areaPopulationSeries =
         new XYChart.Series<Long, Long>(areaToPopulation);
      final ObservableList<XYChart.Series<Long, Long>> series =
         FXCollections.observableArrayList();
      areaPopulationSeries.setName("State Land Area and Population");
      series.add(areaPopulationSeries);
      return series;
   }


   /**
    * Build a Scatter Chart depicting correlation between land area and population
    * for each state.
    *
    * @return Scatter Chart depicting correlation between land area and population
    *    for each state.
    */
   public XYChart buildStatesLandSizePopulationScatterChart()
   {
      final ValueAxis xAxis = new NumberAxis(0, LAND_AREA_KM_MAXIMUM, 50_000);
      xAxis.setLabel("Land Area (km)");
      final ValueAxis yAxis = new NumberAxis(0, POPULATION_RANGE_MAXIMUM, 2_000_000);
      yAxis.setLabel("Population");
      final ScatterChart xyChart = new ScatterChart(xAxis, yAxis, buildAreaToPopulation());
      xyChart.setMinHeight(CHART_HEIGHT);

      return xyChart;
   }

The scatter charts help to visually determine if there is any correlation between a state’s land size and its population. Partially because Alaska and Wyoming are included in the set of sample states, there is not much of a correlation. There is much more that can be done to style the JavaFX Scatter Chart.
It is sometimes useful to see more than one series plotted against the same bar chart. To illustrate multiple series in the same bar chart, I’m going to change the same data being used. Instead of using data on states and their sizes and populations, I’m going to use the data shown in the original code listing related to movie ratings. In particular, there are three series here: critics’ ratings, “normal” audience members’ ratings, and my own ratings. As with the previous examples, I show the code first (most interesting part is method buildRatingsToMovieTitle()), followed by the output.
Generating Movie Rating Bar Chart with Multiple Series (Multiple Rating Groups)
/**
    * Build one or more series of XYChart Data representing movie names as 'x'
    * portion and movie ratings as 'y' portion. This method is likely to be
    * used in vertical presentations where movie names are desired on the x-axis
    * and movie ratings are desired on the y-axis. This method illustrates
    * multiple series as ratings for both normal audience members and critics
    * are shown.
    *
    * @return Series of XYChar Data representing state movie names as 'x' portion
    *    and movie ratings as 'y' portion.
    */
   public ObservableList<XYChart.Series<String,Double>> buildRatingsToMovieTitle()
   {
      final ObservableList<XYChart.Data<String,Double>> normalRatings =
         FXCollections.observableArrayList();
      final ObservableList<XYChart.Data<String,Double>> criticRatings =
         FXCollections.observableArrayList();
      final ObservableList<XYChart.Data<String,Double>> dustinRatings =
         FXCollections.observableArrayList();
      for (final Movie movie : Movie.values())
      {
         final XYChart.Data<String,Double> normalRatingsData =
            new XYChart.Data<String,Double>(
               movie.movieName, movieRatingsNormal.get(movie.movieName));
         normalRatings.add(normalRatingsData);
         final XYChart.Data<String,Double> criticRatingsData =
            new XYChart.Data<String,Double>(
               movie.movieName, movieRatingsCritics.get(movie.movieName));
         criticRatings.add(criticRatingsData);
         final XYChart.Data<String,Double> dustinRatingsData =
            new XYChart.Data<String,Double>(
               movie.movieName, movieRatingsDustin.get(movie.movieName));
         dustinRatings.add(dustinRatingsData);
      }
      final XYChart.Series<String, Double> normalSeries =
         new XYChart.Series<String, Double>(normalRatings);
      normalSeries.setName("Normal Audience");
      final XYChart.Series<String, Double> criticSeries =
         new XYChart.Series<String, Double>(criticRatings);
      criticSeries.setName("Critics");
      final XYChart.Series<String, Double> dustinSeries =
         new XYChart.Series<String, Double>(dustinRatings);
      dustinSeries.setName("Dustin");
      final ObservableList<XYChart.Series<String, Double>> series =
         FXCollections.observableArrayList();
      series.add(normalSeries);
      series.add(criticSeries);
      series.add(dustinSeries);
      return series;
   }

   /**
    * Build vertical bar chart comparing movie ratings to demonstrate multiple
    * series used in a single chart.
    *
    * @return Vertical bar chart comparing movie ratings.
    */
   public XYChart buildVerticalMovieRatingsBarChart()
   {
      final ValueAxis ratingAxis = new NumberAxis(0, MOVIE_RATING_MAXIMUM, 1.0);
      final BarChart ratingBarChart =
         new BarChart(buildMovieRatingsAxis(), ratingAxis, buildRatingsToMovieTitle());
      ratingBarChart.setMinWidth(MOVIE_CHART_WIDTH);
      ratingBarChart.setMinHeight(CHART_HEIGHT);
      ratingBarChart.setTitle("Movie Ratings");
      return ratingBarChart;
   }

JavaFX 2.1 beta includes a couple new charts, including the StackedBarChart. The stacked bar chart implies multiple series, so I will adapt the last example to use one of these. The stacked bar chart will show each of the three ratings sources contributing to a single bar per movie rather than three bars per movie as in the last example.
Generating StackedBarChart of Movie Ratings
/**
    * Build one or more series of XYChart Data representing movie names as 'x'
    * portion and movie ratings as 'y' portion. This method is likely to be
    * used in vertical presentations where movie names are desired on the x-axis
    * and movie ratings are desired on the y-axis. This method illustrates
    * multiple series as ratings for both normal audience members and critics
    * are shown.
    *
    * @return Series of XYChar Data representing state movie names as 'x' portion
    *    and movie ratings as 'y' portion.
    */
   public ObservableList<XYChart.Series<String,Double>> buildRatingsToMovieTitle()
   {
      final ObservableList<XYChart.Data<String,Double>> normalRatings =
         FXCollections.observableArrayList();
      final ObservableList<XYChart.Data<String,Double>> criticRatings =
         FXCollections.observableArrayList();
      final ObservableList<XYChart.Data<String,Double>> dustinRatings =
         FXCollections.observableArrayList();
      for (final Movie movie : Movie.values())
      {
         final XYChart.Data<String,Double> normalRatingsData =
            new XYChart.Data<String,Double>(
               movie.movieName, movieRatingsNormal.get(movie.movieName));
         normalRatings.add(normalRatingsData);
         final XYChart.Data<String,Double> criticRatingsData =
            new XYChart.Data<String,Double>(
               movie.movieName, movieRatingsCritics.get(movie.movieName));
         criticRatings.add(criticRatingsData);
         final XYChart.Data<String,Double> dustinRatingsData =
            new XYChart.Data<String,Double>(
               movie.movieName, movieRatingsDustin.get(movie.movieName));
         dustinRatings.add(dustinRatingsData);
      }
      final XYChart.Series<String, Double> normalSeries =
         new XYChart.Series<String, Double>(normalRatings);
      normalSeries.setName("Normal Audience");
      final XYChart.Series<String, Double> criticSeries =
         new XYChart.Series<String, Double>(criticRatings);
      criticSeries.setName("Critics");
      final XYChart.Series<String, Double> dustinSeries =
         new XYChart.Series<String, Double>(dustinRatings);
      dustinSeries.setName("Dustin");
      final ObservableList<XYChart.Series<String, Double>> series =
         FXCollections.observableArrayList();
      series.add(normalSeries);
      series.add(criticSeries);
      series.add(dustinSeries);
      return series;
   }


   /**
    * Build a Stacked Bar Chart depicting total ratings of each movie based on
    * contributions of three ratings groups.
    *
    * @return Stacked Bar Chart depicting three rating groups' contributions
    *    to overall movie rating.
    */
   public XYChart buildStackedMovieRatingsBarChart()
   {
      final ValueAxis ratingAxis = new NumberAxis(0, MOVIE_RATING_MAXIMUM*3, 2.5);
      final StackedBarChart ratingBarChart =
         new StackedBarChart(buildMovieRatingsAxis(), ratingAxis, buildRatingsToMovieTitle());
      ratingBarChart.setMinWidth(MOVIE_CHART_WIDTH);
      ratingBarChart.setMinHeight(CHART_HEIGHT);
      ratingBarChart.setTitle("Movie Ratings");
      return ratingBarChart;
   }

The stacked bar chart is helpful because it provides a quick view of the overall composite rating of each movie along with how much each reviewer group contributed to that overall rating.
JavaFX 2.0 Charts Documentation
The Using JavaFX Charts tutorial covers code examples and corresponding generated chart images for different types of JavaFX 2.0 charts such as pie chart, line chart, area chart, bubble chart, scatter chart, and bar chart. This tutorial also provides sections on using CSS to style charts and information on preparing chart data and generating custom charts.
Conclusion
This post has demonstrated use of the JavaFX charts package to generate bar charts, scatter charts, and stacked bar charts. When JavaFX is accepted as a standard part of the Java SE SDK, it will bring a standard mechanism for generating charts in Java to the SDK.
Reference: JavaFX 2.0 Bar and Scatter Charts (and JavaFX 2.1 StackedBarCharts) from our JCG partner Dustin Marx at the Inspired by Actual Events blog.
