Are you looking to get away from proprietary instrumentation?
Are you interested in open source observability but lack the knowledge to just dive right in?
This workshop is for you, designed to expand your knowledge and understanding of open source observability tooling that is available to you today.
Dive right into a free, online, self paced, hands-on workshop introducing you to Prometheus. Prometheus is an open source systems monitoring and alerting tool kit that enables you to hit the ground running with discovering, collecting, and querying your observability today. Over the course of this workshop you will learn what Prometheus is, what it is not, install it, start collecting metrics, and learn all the things you need to know to become effective at running Prometheus in your observability stack.
Previously I shared an introduction to Prometheus in a lab that kicked off this workshop. In this article you’ll be installing Prometheus, from either a pre-built binary from the project or using a container image.
I’m going to get you started on your learning path with this first lab that provides a quick introduction to all things needed for metrics monitoring with Prometheus. Note this article is only a short summary, so please see the complete lab found online here to work through it in its entirety yourself:
The following is a short overview of what is in this specific lab of the workshop. Each lab starts with a goal, in this case it is fairly simple:
This lab guides you through installing Prometheus on your local machine, configuring, and running it to start gathering metrics.
In this lab you are confronted right from the start with two possible paths to installing the Prometheus tooling locally on your machine; using a pre-compiled binary for your machine’s architecture, or using a container image.
Installing binaries
The first path you can take to installing Prometheus on your local machine is to obtain the right version of the pre-compiled binaries for your machine architecture. I’ve provided the links to directly obtain Mac OSX, Linux, and Windows binaries.
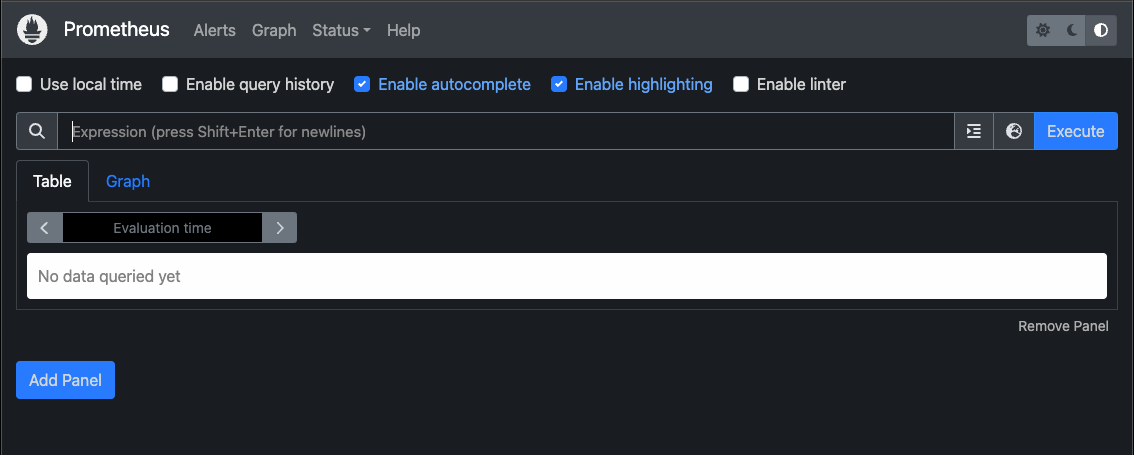
The installation is straightforward and you’ll learn what a basic configuration looks like, while creating your own to get started with scraping your first metrics from the Prometheus server itself. Once it’s up and running, you’ll explore the basic information available to you through the Prometheus status pages, a web console.
You explore how to verify that your configured scraping target is up and running, then go and break your configuration to see what a broken target looks like on the web console status page. Next you browse the available configuration flags for running your Prometheus server, look at the time series database status, explore your active configuration, and finish up by playing with some yet to be explained query expressions in the provided tooling. That last exercise is more extensive than just pasting in queries, you’ll learn about built-in validation mechanisms and explore the graphing visualization offered out of the box.
This lab completes with you having an installed binary package for your machine’s architecture, a running Prometheus with a basic configuration, and an understanding of the available tooling in the provided web console.
Installing container image
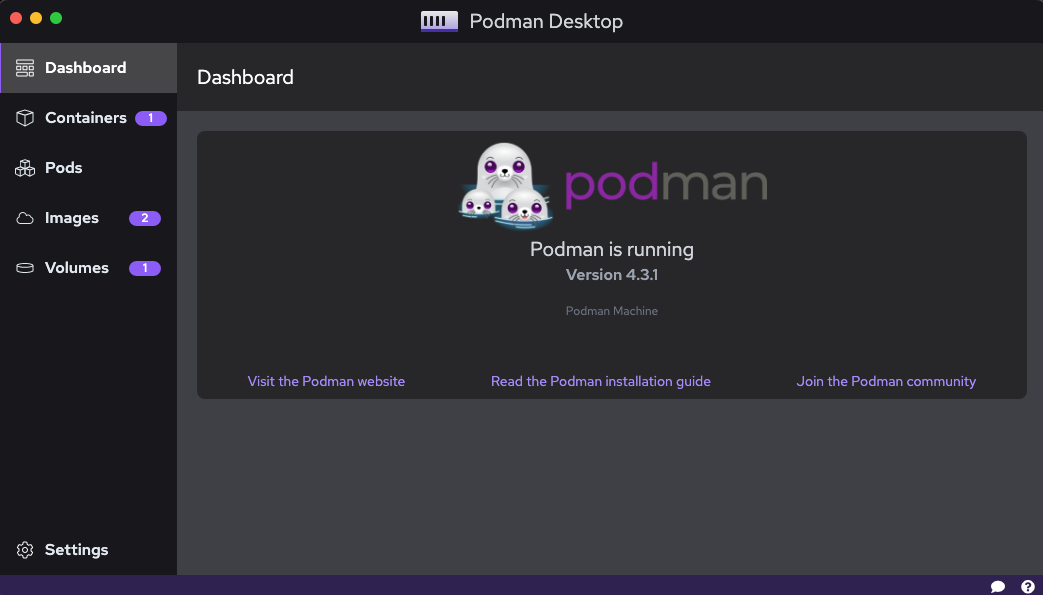
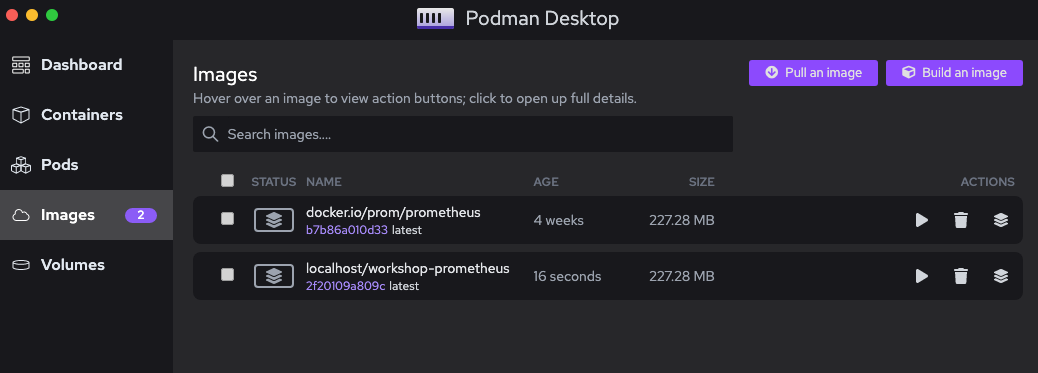
The second path you can take is to install Prometheus using a container image. This lab path is provided using an Open Container Initiative (OCI) standards compliant tool known as Podman. The default requirement will be to use Podman Desktop, a graphical tool that also includes the command line tooling referred to in the rest of this lab.
I’ve chosen to avoid the more complex issues of mounting a volume for your local configuration file to be made available to your running Prometheus container image, instead choosing to walk you through a few short steps to building your own local container image with your workshop configuration file. Once all of this is done, you are up and running with your Prometheus server just like the previous section.
The rest of this path covers the same as previously covered in the above section, where you explore all the basic information available to you through the Prometheus status pages through its web console.
Missed previous labs?
This is one lab in the more extensive free online workshop. Feel free to start from the very beginning of this workshop here if you missed anything previously:
You can always proceed at your own pace and return any time you like as you work your way through this workshop. Just stop and later restart Perses to pick up where you left off.
Coming up next
I’ll be taking you through the following lab in this workshop where you’ll start learning about the Prometheus Query Language and how to gain insights into your collected metrics. Stay tuned for more hands on material to help you with your cloud native observability journey.
|
Published on Java Code Geeks with permission by Eric Schabell, partner at our JCG program. See the original article here: Getting Started With Prometheus – Installing Prometheus Opinions expressed by Java Code Geeks contributors are their own. |