In this series of simulating and troubleshooting performance problems in Kotlin articles, let’s discuss how to simulate CPU consumption to spike up to 100% on a host (or container). CPU consumption will spike up whenever a thread goes on an infinite loop.
Kotlin CPU Spike Program
Here is a sample kotlin program, which generates the cpu spike.
package com.buggyapp
class CPUSpikeApp{
      fun start() {
          CPUSpikerThread().start()
          CPUSpikerThread().start()
          CPUSpikerThread().start()
          CPUSpikerThread().start()
          CPUSpikerThread().start()
          CPUSpikerThread().start()
          println("6 threads launched!")
      }
}

class CPUSpikerThread : Thread() {
      override fun run() {
          while (true) {
          // Just looping infinitely
          }
      }
}
When a thread goes on an infinite loop, the CPU will start to spike up. In the above program, we are putting 6 threads to go on an infinite loop. In this program you will notice the ‘CPUSpikeApp’ class. In this class, 6 threads with the name ‘CPUSpikerThread’ are launched. If you notice the ‘CPUSpikerThread’ class code, there is a ‘while (true)’ loop without any code in it. This condition will cause the thread to go on an infinite loop. Since the 6 threads are executing this code, all those 6 threads will go on an infinite loop. When this program is executed, CPU consumption will skyrocket on the machine.
How to troubleshoot Kotlin CPU Spike?
You can diagnose CPU spike either through a manual or automated approach.
Manual approach:
As highlighted in this article, you can use manual approach to troubleshoot :
- Capture thread dump from the application
- Capture ‘top -H -p {PID}’ output
- Marry these #a and #b and identify the root cause of the CPU spike problem
Automated approach:
On the other hand, you can also use yCrash open source script, which would capture 360-degree data (GC log, 3 snapshots of thread dump, heap dump, netstat, iostat, vmstat, top, top -H,…) from your application stack within a minute and generate a bundle zip file. You can then either manually analyze these artifacts or upload it to yCrash server for automated analysis.
We used the Automated approach. Once the captured artifacts were uploaded to the yCrash server, it instantly generated the below root cause analysis report highlighting the source of the problem.
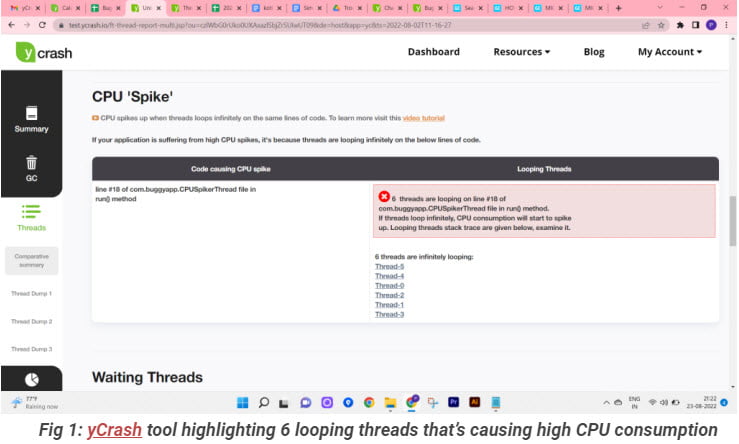

Fig 1 is the yCrash report that points out the 6 threads are causing the CPU to spike up: Thread-5, Thread-4, Thread-0, Thread-2, Thread-1, Thread-3.These are the 6 threads that was created in the above kotlin program. When you click on the thread names in the report, you will see the stack traces of those threads (as shown in Fig 2).
In Fig 2, you can notice that the tool is pointing out exact lines of code i.e., com.buggyapp.CPUSpikerThread.run(CPUSpikeApp.kt:18) where the threads are infinitely looping & causing the CPU to spike up. Equipped with this information one can easily go ahead and fix the problematic code.
|
Published on Java Code Geeks with permission by Ram Lakshmanan, partner at our JCG program. See the original article here: Simulating & troubleshooting CPU spike in Kotlin Opinions expressed by Java Code Geeks contributors are their own. |
