We all know that a lot of web traffic worldwide came from mobile devices these days. But have you ever wondered exactly what percentage of it is coming from mobile? Well, mobile devices account for around 50% of the web traffic, which is continually increasing. This is why having a mobile-first approach in 2020 is not just a suggestion. It is an absolute must! With that in mind, this blog takes you through how to debug a website on Android mobile platforms for an enhanced user experience — wondering why Android?
The answer is pretty simple; Android is one of the most famous mobile platforms globally, accounting for 74% of the market share. And it’s pre-installed on approx 2.5 billion devices, making it crucial for developers to optimize their website pages for Android.
For remote debugging on Android, the preferable browser is mainly Chrome. Since it is pre-installed, and countless customers are already familiar with it.
In short, Chrome is dominating the mobile browser segment. Besides, the leading browsers now offer tools to aid the test and debug a website on Android. Remote debugging web apps and sites meant for mobile devices like Android can help fix problems and improve UX on handheld devices.
Remote debugging in Chrome permits you to connect your Chrome’s developer tools on a Computer to your device (Android device) running mobile Chrome. This one can have the Chrome developer tools’ complete access for your browser (in the device)! The process of debugging a website on Android isn’t simple work. Most browsers are designed to be rapid and fluid, and to accomplish this, debug functions are generally not integrated. The following section takes you through a chronological guide on remote debugging on Android with Chrome, Mozilla, and Opera.
Let’s get to it, shall we?
TABLE OF CONTENT
- Ways To Connect Your Desktop System And The Android Device.
- How To Debug Websites On Android With Chrome?
- How To Debug Websites On Android With Mozilla Firefox?
- How To Debug Websites On Android With Opera Mobile?
- Debugging Websites Made Easy Via Cross Browser Testing
Ways To Connect Your Desktop System And The Android Device
Having enunciated the challenges one might face while facilitating remote debugging on Android, on a mobile screen with a tiny screen resolution, one can always opt to connect their mobile devices to desktops for a hassle-free debugging experience manually. You can do it in the following way:
Your desktop system can easily communicate with your mobile gadget with the aid of ADB (Android Debug Bridge). ADB is a coherent and versatile command-line tool that enables anyone to execute commands on a mobile device. Now, let us elaborate on the procedure for successfully using ADB in remote debugging Android devices:
- Enable USB debugging in your cell phone and connect it to the desktop using the USB portal.
- Try to make sure that you have already set up the right version of Android SDK.
- You need to install Android Debug Bridge in the “platform-tools” directory.
- Properly examine whether it is functioning or not by implementing the Android Debug Bridge devices command. If the output includes the device name connected to your workstation, this means that ADB is functioning well.
- Now, the desktop browser must have the Android Debug Bridge helper add-on installed. If it is not there, you can browse the Projects menu and map to “Manage Extra Components.” The window called “Extra components” will become visible, comprising an entry for ADB helper. Navigate to the install button, and it will be further inserted into your desktop browser.
How To Debug Websites On Android With Chrome?
Testing a web application of any mobile can get difficult, mainly when problems such as obfuscated CSS/ javascript/ HTML code, improperly executed page load performance, HTTPS, browser inconsistencies, and so on. Furthermore, some things can be tremendously agonizing while striving to assist and support various mobile devices.
How to overcome these problems? Using debugging extensions or Web Developer Tools like Chrome Developer Tools can subsequently ease up the procedure of remote debugging on Android, making your web application and websites on Android devices error-free. You can even debug local mobile pages on your Android phone using Chrome Developer Tools.
The Chrome DevTools is a consolidated environment pre-built into the Chrome Browser. Google Chrome DevTools is useful for web authoring, scrutinizing, remote debugging with Chrome, optimizing, and understanding websites or web applications. Now let us learn about the key features of Chrome DevTools that make it an excellent tool for remote debugging on Android.
Some of the main features of Chrome DevTools:
- Examine and edit the CSS and DOM of the site in real-time
- Run code snippets from any webpage
- Debug complex or obfuscated code
- Put sophisticated breakpoints & debug JavaScript by making use of the graphical debugger
- Troubleshoot security problems
- Inspect page performance as well as run-time for improving your app’s speed
- Uncover reflows and repaints as your application loads
The Chrome Developer Tools gives almost all the gears necessary to examine, remote debugging with Chrome, and check the web app/mobile web’s performance. It also facilitates stimulating devices for testing and building mobile-first, responsive sites.
You can even debug the content of the website on an actual Android device from a development device. However, it isn’t enough to test your web application or website on merely one or two devices, which is when cross browser testing comes into play. It ensures that the UI of your application is maintained across countless devices and browsers. Given below is the step-by-step follow-through on how to debug a website on Android using different browsers.
Step 1: Find out your Android device
The given steps will work for the majority of users.
- Open the Developer Options screen on the Android device. Try to check the options- Configure On-Device Developer.
- Click on Enable USB Debugging.
- Open Google Chrome on your development device.
- Browse chrome://inspect#devices.
- Ensure that the Discover USB devices checkbox is enabled, in case it isn’t.

debug website on android
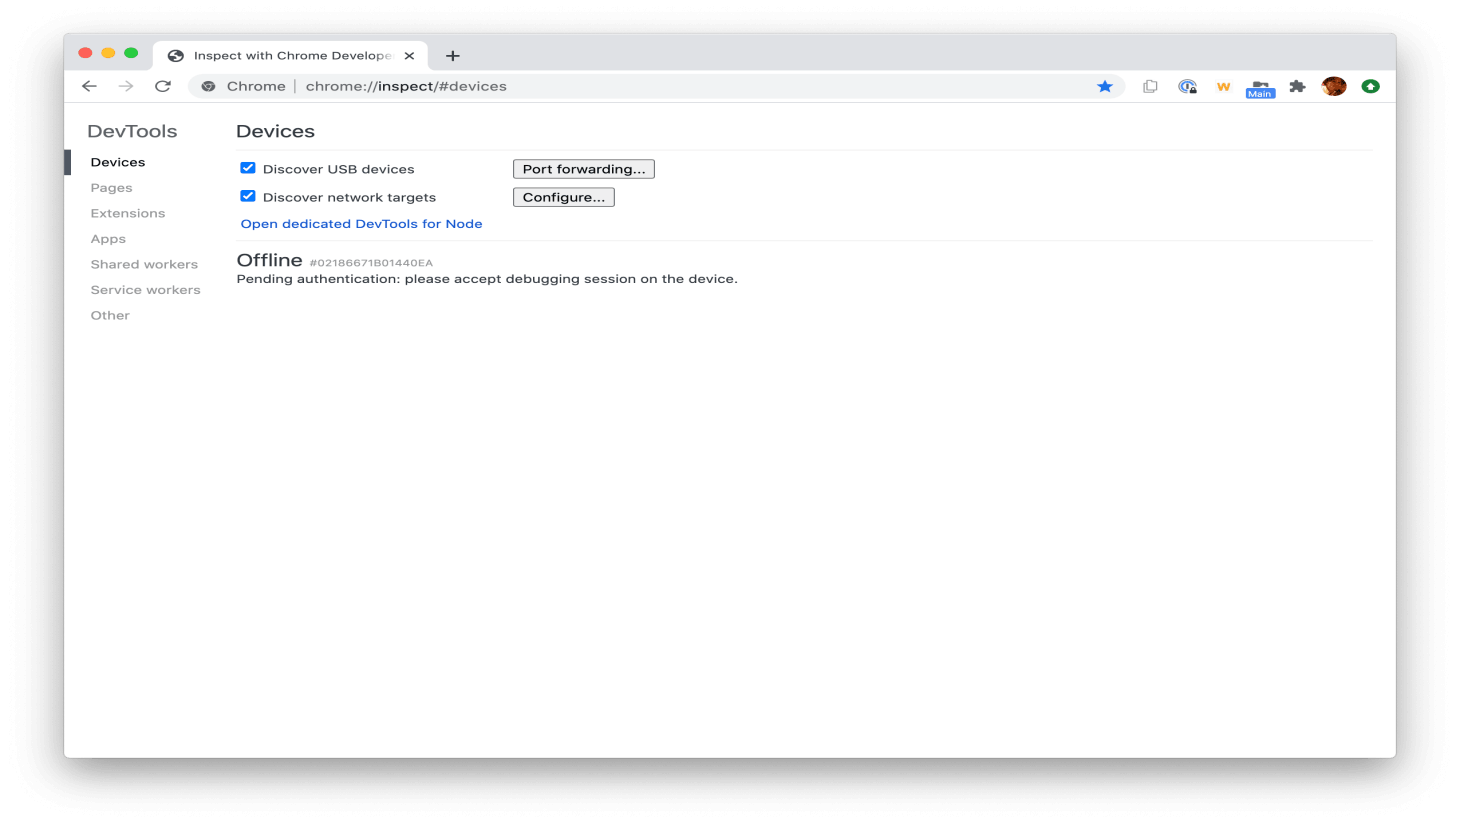
- After that, try to connect your device (Android device) straight to your development machine via a USB cable. At first, you will generally notice that Developer Tools has discovered an offline device. If you observe your Android device’s model name, this means DevTools has effectively established the connection to your gadget.

The Remote Target has smartly discovered an offline device that is pending approval appearing up as Offline; accept the Enable USB Debugging authorization directly on your device.
Troubleshooting: DevTools is not discovering the gadget
As mentioned above, sometimes, Chrome DevTools may take some time to discover the Android device due to troubleshooting problems. In such a case, you can carry out the following suggestions to speed up the process to enable remote debugging with Chrome.
Confirm that your software is set up rightly:
- If your development machine is operating on Windows, try manual installation of the USB drivers (Android device). Check further- Set up OEM USB Drivers.
- Some arrangements of Android devices (particularly Samsung) and Windows necessitate a few extra steps for setting up to start remote debugging with Chrome.
Confirm that your system hardware is set up accurately:
- If you are utilizing a USB hub, try linking your Android device straight to your development machine in its place.
- Attempt unplugging the USB cable connecting your development machine to your Android device, and afterward, try plugging it back in. Perform this action while your development machine and Android screens are unlocked.
- Confirm that your USB cable is working correctly. You have to be capable of examining files on your device (Android device) straight from your development machine.
If in case you can’t see the Enable USB Debugging prompt on your device, then undertake these steps:
- Re-connect after disconnecting the USB cable while Developer Tools is being deployed, laying focus on your development machine and the home screen of your Android device, making sure they are unlocked. In different words, occasionally, the prompt does not appear at the time your development machine or Android screens are locked.
- Upgrading your Android device and development machine’s display settings so that they never stay in sleep mode may also solve the issue.
- Setting USB mode to PTP on your Android device can be of help as well. From the Developer Options screen on your gadget, select Revoke USB Debugging Approvals and Authorizations to retune it to a fresh condition.
Step 2: From your development machine, try to debug content on your device
- Open Google Chrome on your device.
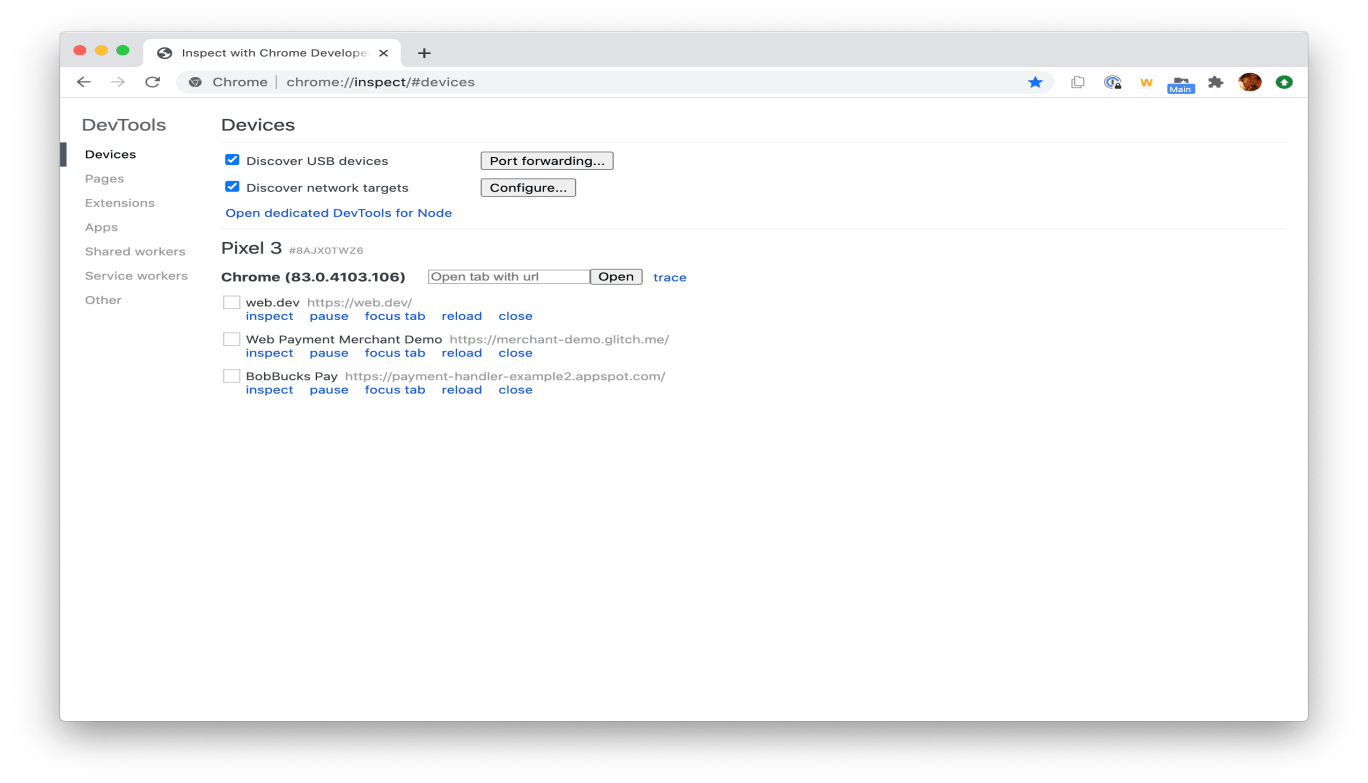
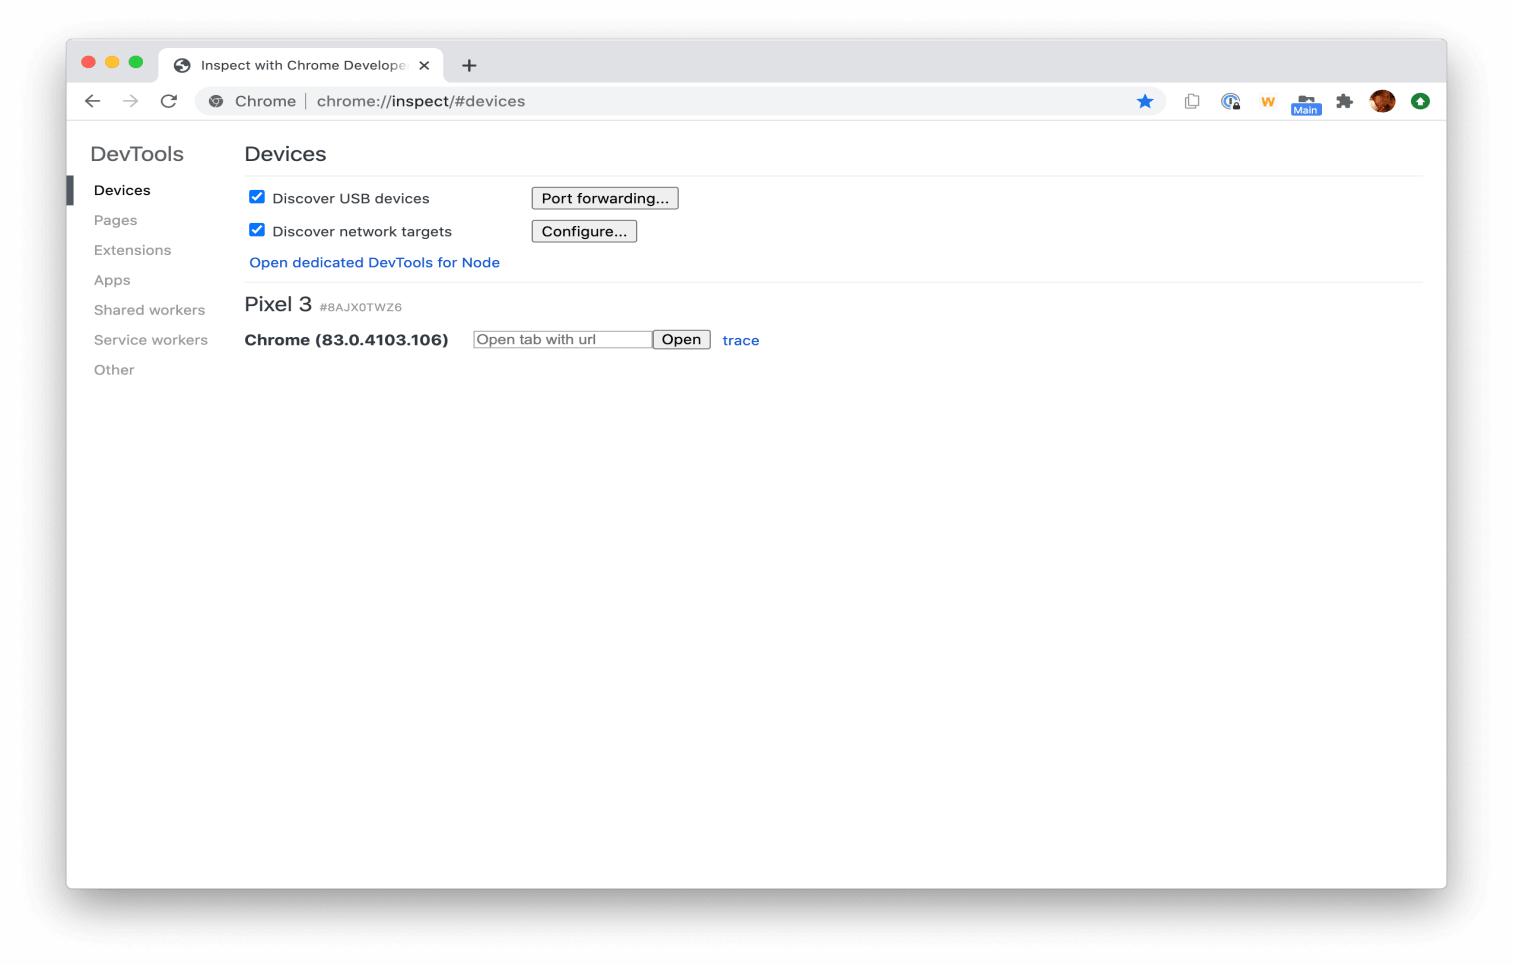
- Within the chrome://inspect/#devices, you can observe the Android’s model name, followed by its serial number. Underneath that, you can notice the Chrome version currently running on the device, with the version number in parenthesis. From this section, you can interconnect with that tab. If there are any applications making use of WebView, you can observe a section for every application, too.

A connected remote device
- In the tab (opened) with the URL text box, go into a URL & then click the ‘Open’ button. The web page opens in a new tab on your device.
- Click Inspect adjacent to the URL that you have opened. You will find that a new Developer Tools instance opens up on your development device. The Chrome version running on your Android device decides the version of Developer Tools that opens on your development device. Therefore, if your Android device runs an extremely outdated Chrome version, the Developer Tools instance may look dissimilar from what you are used to.
You can discover options to reload, focus tab, pause, or close under the URL.
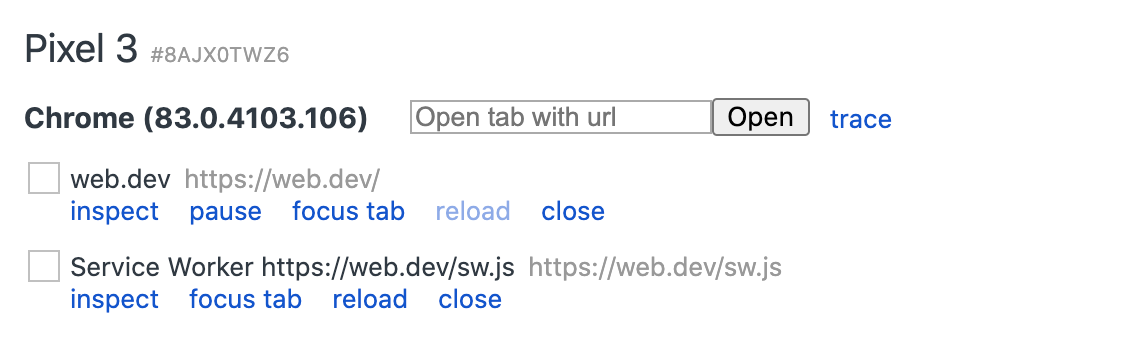
The options for inspecting, pausing, reloading, focusing, or closing a tab in Google Chrome.
How can we inspect elements?
Visit the Elements panel of your Developer Tools instance. After that, hover over a part to highlight it in your Android device’s viewport.
One can also tap the component on the device screen to choose it in the Elements panel. On your DevTools instance, go to Select Element & afterward tap the element on your machine screen. Make a note that the chosen element is disabled after the earlier touch, so you are required to re-enable it each moment you wish to make use of this feature.
Screencast your screen to your development device (Android)
Go to Toggle Screencast to check your Android device’s content in your DevTools instance.
One can effortlessly interact with the Screencast in varied methods:
- Keystrokes on your system are directly sent to the machine.
- Clicks are transformed into taps, firing appropriate touch events on the machine.
- To imitate a pinch gesture, take hold of Shift while hovering and dragging.
- To scroll, use your mouse wheel or trackpad, or fling with the pointer of your mouse.
Important Notes on Screencasts
Screencasts mainly display the content of the page. The Screencast’s transparent portions signify device interfaces, like the Android keyboard, the Android status bar, or the Chrome address bar. Screencasts depressingly affect frame rates. You will have to disable screencasting while evaluating animations or scrolls to obtain your page performance’s correct image. While if your device screen gets locked, your screencast content can quickly disappear. Unlock your device screen to return the Screencast automatically.
How To Debug Websites On Android With Mozilla Firefox?
Now that we’ve learned about remote debugging on Android with Google Chrome. Let’s discuss another popular browser – Mozilla Firefox. For remote debugging on Android with Mozilla, you need to take care of these pre-defined specifications.
For any Android gadget, these things are necessary:
- Android version 4 or above.
- The latest Firefox version, mainly version 35 or above.
- If, in case, you are using Windows, then USB drivers are necessary.
- Enabled USB debugging in the developer selections for Android.
How does it make debugging simpler for developers?
Begin with Remote Debugging
Given below is a step-by-step way to enable remote debugging for both your computer system and mobile.
On the system:
- First, Open Mozilla Firefox.
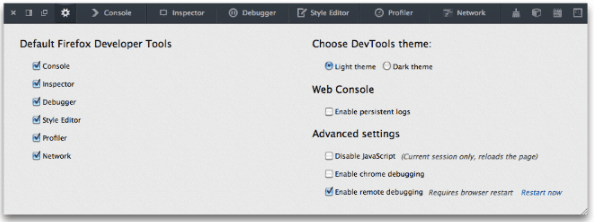
- Click the Toolbox and visit Settings.
- Try to enable the checkbox of the remote debugging, which will be found below the settings tab. Select enable and close the Toolbox.

On the mobile gadget:
- Open Mozilla Firefox and click the Menu.
- Go to the settings, browse the Developer Tools option. Enable the checkbox of “Remote Debugging.”
- Now, If you have the latest Firefox version pre-installed, connecting will be simpler than above. Browse to command prompt and run the command mentioned below:
“adb forward tcp:6000 localfilesystem:/data/data/org.mozilla.firefox/firefox-debugger-socket”
- After implementing the commands, in Mozilla Firefox, at your system, go to the Web Developer option and click on “Connect.” The tab page will appear comprising the port number and hostname.
- After clicking on the connect button, a pop up will come out on the device asking permission to verify. Click ‘Ok,’ and your device will be connected to the system.
- You will get a notification in the desktop window displaying that the connection has been established. In the mobile browser, the default tabs will now be accessible on the system.

For every tab that you will open on your gadget, the website’s name will be included below the “Available remote tabs.” Clicking a tab will open the tab counting developer console on the system, permitting you to debug the web page that you require.
Restrictions of the Debugger and Ways to Beat Them
From version 52, Mozilla Firefox has launched a new debugger (which in the developer edition is enabled by default). Even though it is much faster and trustworthy, there are some restrictions to it. For instance, the Document Object Model (DOM) event breakpoints aren’t supported by the new debugger. When you attempt to debug your JavaScript, breakpoints are significant as it can command the debugger to end event execution. This drawback of the new debugger will make it hard for the development team for debugging script-associated problems in Android.
Besides, the new debugger doesn’t support examining DOM nodes. While you drag the pointer on a DOM node in the console (developer console), it is displayed on the provided webpage. As these traits aren’t supported, developers might have to return to the earlier debugger version to use it. This can be completed by opening the about: config wherein you can find a preference termed “devtools.debugger.new-debugger-frontend”. Highlight it false, and you can examine DOM nodes & set breakpoints yet again.
Mozilla Firefox’s remote debugger is simpler to use and simpler to install or setup than other significant browsers and allows developers to debug their site problems in Android and mitigate them earlier to deployment. Even though the most advanced version also has quite a few limitations, they might be fixed in the upcoming release.
How To Debug Websites On Android With Opera Mobile?
While talking about how to debug a website on Android, one cannot simply forget to mention Dragonfly. Dragonfly is one of the best tools that can be used for debugging and editing sites on your Android device from your desktop system.
Let’s glance at how to connect to your smart device and start debugging directly using Opera Mobile and Dragonfly!
Dragonfly
- Dragonfly is considered to be the best tool and Opera’s version of Firebug & Chrome DevTools.
- It comes packed with Opera’s desktop version.
- It is a web application, which upgrades itself automatically.
- If you wish to open it, simply press Ctrl + Shift + I or by going to the main Menu -> Page- Developer tools -> Dragonfly.
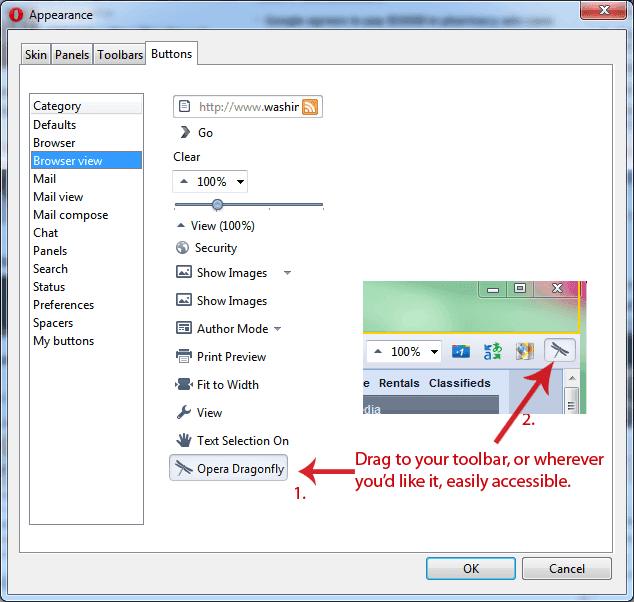
You may also wish to place the fast access button in the toolbar. To execute it, press Shift + F12 -> Buttons -> Browser View. Afterward, hover and drag the Opera Dragonfly button onto your toolbar, as demonstrated below.
Connecting for remote debugging
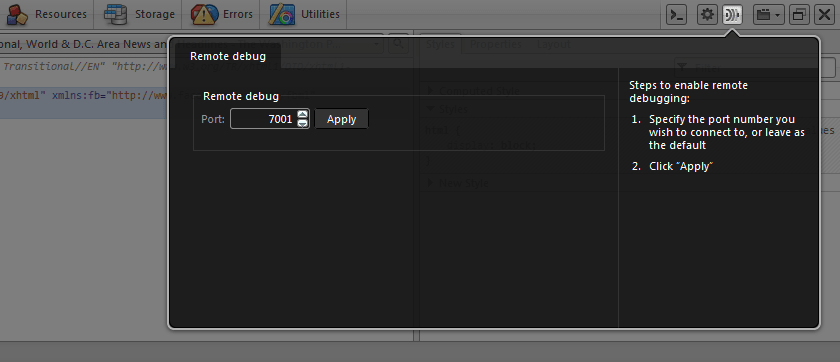
- After you have opened Dragonfly on your system, click on the button named “Remote debug configuration” as shown below, put a port number (default: 7001, which works just fine most of the time), and then click on apply.

- Search the local IP address of your PC.
- Connect your Android phone to a similar network as your system via WiFi.
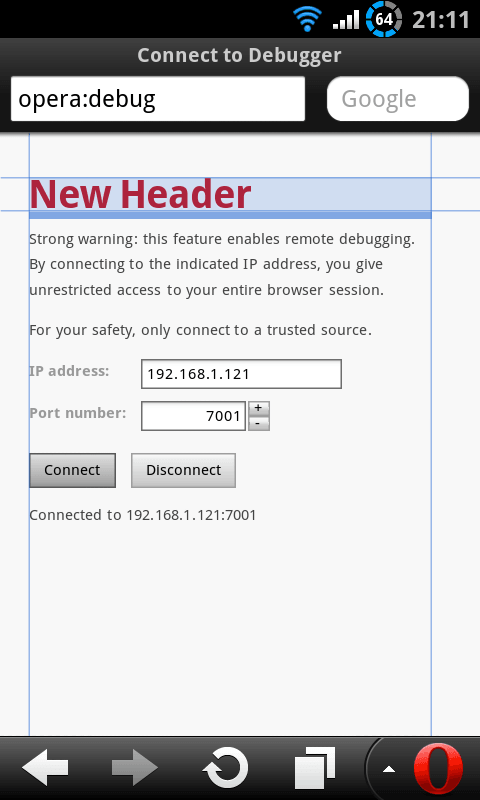
- After that, open Opera Mobile and go to about: debug in the URL bar as displayed in the image attached below.

- Fill in the port number of your computer and IP address, and click on “connect.”
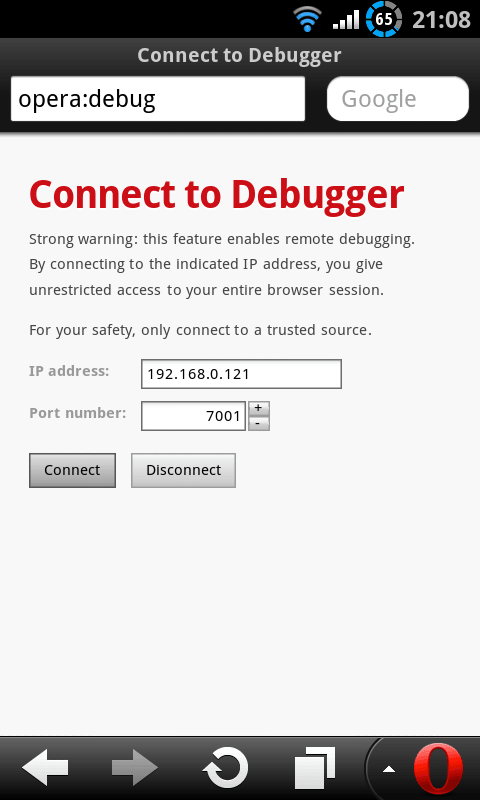
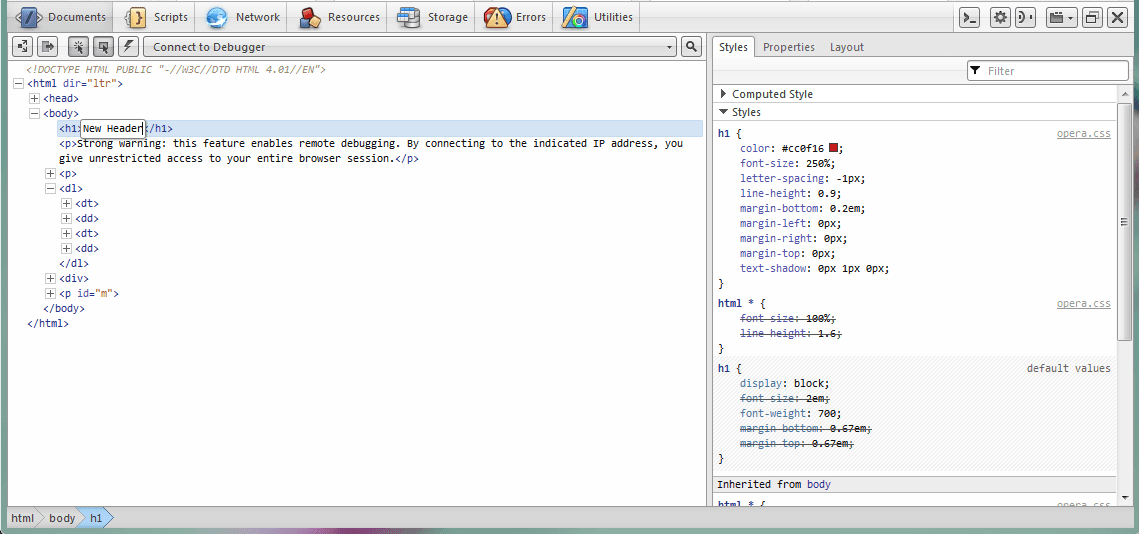
If you have connected it correctly, Dragonfly will start loading the HTML of the presently active site in Opera Mobile, that would be the “Connect to Debugger” site where we click on the connection button.
If you expand the Document Object Model and go to the H1 tag or hover the mouse over the tag, you can notice the header being selected in Opera Mobile on the gadget!
Action of some editing
Now you can edit the website’s header by double-clicking it and filling in some new text.
And the modifications become visible on the mobile device immediately as “New Header,” just as shown in the image below:
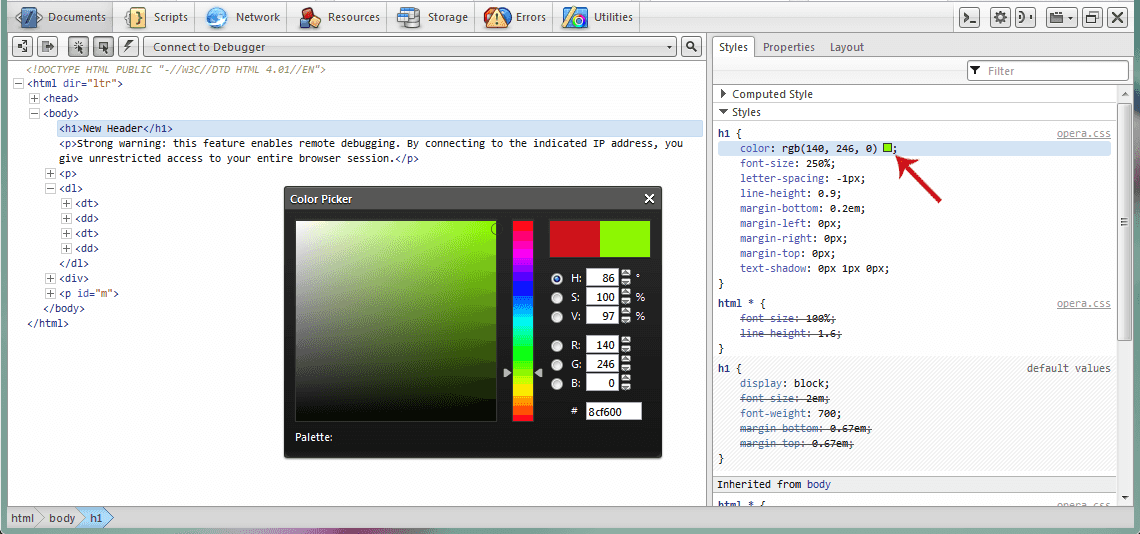
You can easily modify some color via CSS to change the header to light green as well:
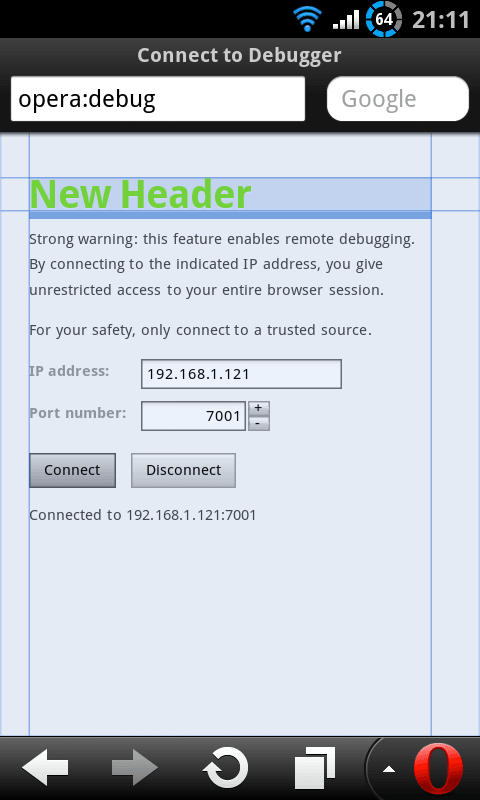
The changes will be immediately displayed on the device:
After that it will display immediately on the device:
Debugging another website
Now that you’ve learned about how to make changes and edits in the display. You are perhaps willing to debug some other site, and you can do this on Opera Mobile by browsing to a new URL in the location or URL bar.
Note- If you consider visiting another site, its HTML will automatically come into view in Dragonfly after the web page has loaded, ready for you to debug with!
Debugging & Some Extra Tips
- When you have completed debugging websites, you can easily hit the button-‘Cancel remote debug‘ in Dragonfly.
- To insert read values, JavaScript, etc., you can get a JavaScript console with the CLICK.
- In case if you need extra space, you can undock Dragonfly to other windows.
Debugging Websites Made Easy Via Cross Browser Testing
By now, we hope you learned how to debug a website on Android with different browsers. Opting for a well-integrated and efficient cross browser testing tool is the easiest way to ensure that your website is completely devoid of bugs each time after updating the code base and deploying changes. It helps maintain your website’s consistency or web application’s UI across a multitude of Windows and Mac operating systems and all the latest browsers, leaving no stones unturned. Using this multifaceted platform, you can test your website or web application on the latest mobile browsers with Android and iOS mobile operating systems.
Furthermore, a cross browser testing tool integrates with your favorite bug logging, project management tool, and your CI/CD Pipeline and allows you to log issues instantly during test sessions. This eliminates the need for manually managing and logging bugs, making debugging websites much easier.
Wrapping up
We took you through a step-by-step follow-through to debug a website on Android with different browsers through this blog. Hopefully, these processes will present you with a new and versatile tool for remote debugging websites on Android and make developing for Android devices quite simpler. Now that you know how to debug websites on Android, maybe you’re interested in learning how to debug it on iPhone – to do that, please read our blog on how to debug websites on the iPhone.
And, yes, if you have any other techniques or tools to troubleshoot your mobile websites, leave them in the comment section below! Till then, enjoy remote debugging on Android.
Frequently Asked Questions
How do I debug Android Browser?
Remote debugging live content on an Android device from your Windows, Mac, or Linux computer requires:
- Setting up your Android device for remote debugging and discovering it from your development machine.
- Inspecting and debugging live content on your Android device from your development machine.
- Screencasting content from your Android device onto a DevTools instance on your development machine.
How do I debug a mobile site?
- Open Developer options. On your Android device, open up the Settings menu and select Developer options.
- USB debugging. Now open the Developer options menu and select the option for USB debugging.
- Configure Chrome to inspect the DOM.
- Start debugging.
How do I debug Chrome?
- To start debugging Chrome, press the F12 function key in the Chrome browser to launch the JavaScript debugger and then click “Scripts”.
- Choose the JavaScript file on top and place the breakpoint to the debugger for the JavaScript code.
- Press Ctrl + Shift + J to open Developer Tools in Chrome.
Written by Praveen Mishra
Praveen is a Computer Science Engineer by degree, and a Digital Marketer by heart who works at LambdaTest. A social media maven, who is eager to learn & share about everything new & trendy in the tech domain.
Published on Java Code Geeks with permission by LambdaTest, partner at our JCG program. See the original article here: How To Debug Websites On Android With Different Browsers? Opinions expressed by Java Code Geeks contributors are their own. |

Thank you for the detailed article. I have a very different problem: I own Galaxy S7+ tablet (12 inch screen) that I use as my primary productivity tool for development. I was socked to learn that there no way for me to run Development tools/console for either Chrome or Firefox. So it is not possible for me to debug websites from my tablet. There is no logical reason I can think on why this feature is turned off and why it can not be turned on by setting an option or something.