MicroServices – Part 6 : Distributed Tracing with Spring Cloud Sleuth and Zipkin
One of the challenges in microservices architecture is the ability to debug issues. A simple user action might trigger a chain of downstream microservice calls. It would be tedious to trace the logs related to a particular user action across microservices. In addition to that, we might want to track down why a certain microservice call is taking so much time. We can use Spring Cloud Sleuth to handle these kinds of issues. Spring Cloud Sleuth provides the distributed tracing capabilities and we can also export these trace information to Zipkin to visualize the call traces.
MicroServices using Spring Boot & Spring Cloud
- Part 1 : MicroServices : Spring Boot & Spring Cloud Overview
- Part 2 : MicroServices : Configuration Management with Spring Cloud Config and Vault
- Part 3 : MicroServices : Spring Cloud Service Registry and Discovery
- Part 4 : MicroServices : Spring Cloud Circuit Breaker using Netflix Hystrix
- Part 5 : MicroServices : Spring Cloud Zuul Proxy as API Gateway
- Part 6 : MicroServices : Distributed Tracing with Spring Cloud Sleuth and Zipkin
In this post we are going to learn:
- Tracing Distributed Service Calls
- Using Spring Cloud Sleuth for Distributed Tracing
- Distributed Tracing with Zipkin Server
Tracing Distributed Service Calls
In the microservices world, a user action on UI may invoke one microservice API endpoint, which in turn invoke another microservice endpoint.
For example, when a user sees the catalog, shoppingcart-ui will invoke catalog-service REST API http://localhost:8181/api/products which in turn calls inventory-service REST API http://localhost:8282/api/inventory to check for inventory availability.
Suppose, an exception has occurred or the data returned is invalid and you want to investigate what is wrong by looking at logs. But as of now, there is no way to correlate the logs of that particular user across multiple services.
Poor man’s distributed tracing
One solution to this is at the beginning of the call chain we can create a CORRELATION_ID and add it to all log statements. Along with it, send CORRELATION_ID as a header to all the downstream services as well so that those downstream services also use CORRELATION_ID in logs. This way we can identify all the log statements related to a particular action across services.
We can implement this solution using MDC feature of Logging frameworks. Typically we will have a WebRequest Interceptor where you can check whether there is a CORRELATION_ID header. If there is no CORRELATION_ID in the header then create a new one and set it in MDC. The logging frameworks include the information set in MDC with all log statements.
But, instead of we doing all this work we can use Spring Cloud Sleuth which will do all this and much more for us.
Using Spring Cloud Sleuth for Distributed Tracing
First, get familiarize with some terminology of Span, Trace, Annotations here http://cloud.spring.io/spring-cloud-static/Finchley.M7/single/spring-cloud.html#_terminology.
Let us add Sleuth starter to both inventory-service and catalog-service.
<dependency>
    <groupId>org.springframework.cloud</groupId>
    <artifactId>spring-cloud-starter-sleuth</artifactId>
</dependency>
Once you add Sleuth starter and start the services you can observe in logs something like this.
2018-03-20 10:19:15.512  INFO [inventory-service,,,] 53685 --- [trap-executor-0] c.n.d.s.r.aws.ConfigClusterResolver ...
2018-03-20 10:24:15.507  INFO [inventory-service,,,] 53685 --- [trap-executor-0] c.n.d.s.r.aws.ConfigClusterResolver ...
Now hit any inventory-service REST endpoint, say http://localhost:8282/api/inventory. Then you can observe TraceID, SpanID in the logs.
2018-03-20 10:15:38.466 INFO [inventory-service,683f8e4370413032,d8abe400c68a9a6b,false] 53685 --- [oryController-3] ...
Sleuth includes the pattern [appname,traceId,spanId,exportable] in logs from the MDC.
Now invoke the catalog-service endpoint http://localhost:8181/api/products endpoint which internally invokes inventory-service endpoint http://localhost:8282/api/inventory.
In catalog-service logs you can find log statements something like:
2018-03-20 10:54:29.625 INFO [catalog-service,0335da07260d3d6f,0335da07260d3d6f,false] 53617 --- [io-8181-exec-10] ...
And, check logs in inventory-service, you can find log statements something like:
2018-03-20 10:54:29.662 INFO [inventory-service,0335da07260d3d6f,1af68249ac3a6902,false] 53685 --- [oryController-6] ...
Observe that TraceID 0335da07260d3d6f is same in both catalog-service and inventory-service for the same REST API call. This way we can easily correlate the logs across services.
The false in [inventory-service,0335da07260d3d6f,1af68249ac3a6902,false] indicates that this trace is not exported to any Tracing Server like Zipkin. Let us see how we can export the tracing information to Zipkin.
Distributed Tracing with Zipkin Server
We learned how to use Sleuth to add tracing information in logs. In addition to that, we can also export this information to Zipkin so that we can visualize this through UI.
Create Zipkin Server as SpringBoot application
We can start Zipkin server as a spring boot application or run in a docker container.
As of now, Zipkin doesn’t support Spring Boot 2. So we can create a SpringBoot application zipkin-server using 1.5.10.RELEASE version and add the zipkin-server, zipkin-autoconfigure-ui dependencies.
<project xmlns="http://maven.apache.org/POM/4.0.0"
    xmlns:xsi="http://www.w3.org/2001/XMLSchema-instance"
    xsi:schemaLocation="http://maven.apache.org/POM/4.0.0
    http://maven.apache.org/xsd/maven-4.0.0.xsd">
    <modelVersion>4.0.0</modelVersion>

    <groupId>com.sivalabs</groupId>
    <artifactId>zipkin-server</artifactId>
    <version>0.0.1-SNAPSHOT</version>
    <packaging>jar</packaging>

    <name>zipkin-server</name>

    <parent>
        <groupId>org.springframework.boot</groupId>
        <artifactId>spring-boot-starter-parent</artifactId>
        <version>1.5.10.RELEASE</version>
    </parent>

    <properties>
        <project.build.sourceEncoding>UTF-8</project.build.sourceEncoding>
        <project.reporting.outputEncoding>UTF-8</project.reporting.outputEncoding>
        <java.version>1.8</java.version>
        <spring-cloud.version>Edgware.RELEASE</spring-cloud.version>
    </properties>
    <dependencies>
        <dependency>
            <groupId>org.springframework.boot</groupId>
            <artifactId>spring-boot-starter-web</artifactId>
        </dependency>
        <dependency>
            <groupId>org.springframework.cloud</groupId>
            <artifactId>spring-cloud-starter-zipkin</artifactId>
        </dependency>
        <dependency>
            <groupId>io.zipkin.java</groupId>
            <artifactId>zipkin-server</artifactId>
        </dependency>
        <dependency>
            <groupId>io.zipkin.java</groupId>
            <artifactId>zipkin-autoconfigure-ui</artifactId>
            <scope>runtime</scope>
        </dependency>
    </dependencies>
    <dependencyManagement>
        <dependencies>
            <dependency>
                <groupId>org.springframework.cloud</groupId>
                <artifactId>spring-cloud-dependencies</artifactId>
                <version>${spring-cloud.version}</version>
                <type>pom</type>
                <scope>import</scope>
            </dependency>
        </dependencies>
    </dependencyManagement>

    <build>
        <plugins>
            <plugin>
                <groupId>org.springframework.boot</groupId>
                <artifactId>spring-boot-maven-plugin</artifactId>
            </plugin>
        </plugins>
    </build>

    <repositories>
        <repository>
            <id>spring-milestones</id>
            <name>Spring Milestones</name>
            <url>https://repo.spring.io/milestone</url>
            <snapshots>
                <enabled>false</enabled>
            </snapshots>
        </repository>
    </repositories>
</project>
Add @EnableZipkinServer annotation to main entry-point class.
import org.springframework.boot.SpringApplication;
import org.springframework.boot.autoconfigure.SpringBootApplication;
import zipkin.server.EnableZipkinServer;

@SpringBootApplication
@EnableZipkinServer
public class ZipkinServerApplication {

    public static void main(String[] args) {
        SpringApplication.run(ZipkinServerApplication.class, args);
    }
}
Set port and application name in application.properties.
spring.application.name=zipkin-server
server.port=9411
Now you can start the Zipkin Server by running ZipkinServerApplication.
Zipkin Server as Docker container
Instead of creating Zipkin server as a SpringBoot application, you can use Docker image for OpenZipkin.
We can create a Zipkin server backed by in-memory datastore using the following docker-compose-mem.yml file.
version: '2'

services:
  # The zipkin process services the UI, and also exposes a POST endpoint that
  # instrumentation can send trace data to. Scribe is enabled by default.
  zipkin:
    image: openzipkin/zipkin
    container_name: zipkin
    # Environment settings are defined here https://github.com/openzipkin/zipkin/tree/1.19.0/zipkin-server#environment-variables
    environment:
      - STORAGE_TYPE=mem
      # Uncomment to disable scribe
      # - SCRIBE_ENABLED=false
      # Uncomment to enable self-tracing
      # - SELF_TRACING_ENABLED=true
      # Uncomment to enable debug logging
      # - JAVA_OPTS=-Dlogging.level.zipkin=DEBUG
    ports:
      # Port used for the Zipkin UI and HTTP Api
      - 9411:9411
You can also use docker image backed by MySQL datastore by using https://github.com/openzipkin/docker-zipkin/blob/master/docker-compose.yml.
Once the Zipkin server is started you can go to http://localhost:9411/ to view the Zipkin Server UI Dashboard.
Exporting tracing info to Zipkin Server
We observed that the tracing information is printed in logs but not exported. We can export them to Zipkin server so that we can visualize traces in Zipkin Server UI Dashboard.
Add Zipkin Client starter to both inventory-service and catalog-service.
<dependency>
    <groupId>org.springframework.cloud</groupId>
    <artifactId>spring-cloud-starter-zipkin</artifactId>
</dependency>
Configure Zipkin server URL in bootstrap.properties of both inventory-service and catalog-service.
spring.zipkin.base-url=http://localhost:9411/
spring.sleuth.sampler.probability=1
NOTE: By default spring.sleuth.sampler.probability=0.1 which means only 10% of tracing information will be exported to Zipkin. Make it to your desired percentage.
Now restart both inventory-service and catalog-service and invoke http://localhost:8181/api/products endpoint. You can observe that true is printed in logs meaning it is exported.
2018-03-20 11:41:02.241 INFO [catalog-service,7d0d44fe314d7758,7d0d44fe314d7758,true] 53617 --- [nio-8181-exec-5] c.s.c.services.ProductService
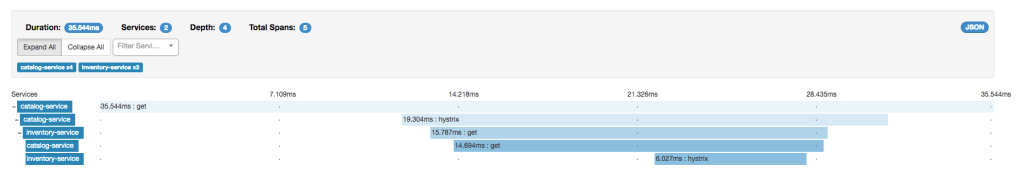
Now go to Zipkin UI Dashboard, you can see the service names populated in the first dropdown. Select the service you want to check or select all and then click on Find Traces button.

Click on any trace you can see the call chain and latency details for each span.
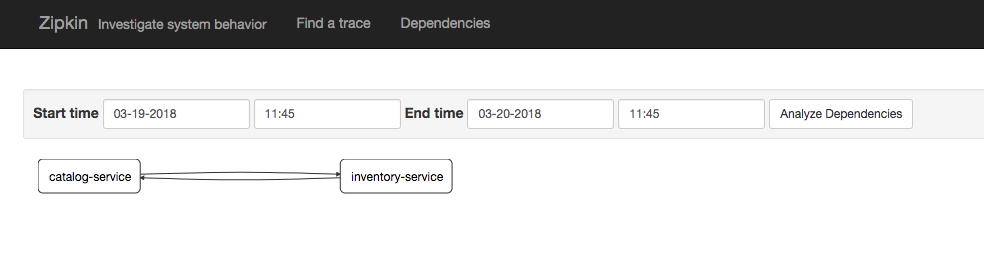
You can also click on Dependencies link in the top nav bar to see the service dependencies.
 You can find the source code for this article at https://github.com/sivaprasadreddy/spring-boot-microservices-series
| Published on Java Code Geeks with permission by Siva Reddy, partner at our JCG program. See the original article here: MicroServices – Part 6 : Distributed Tracing with Spring Cloud Sleuth and Zipkin
Opinions expressed by Java Code Geeks contributors are their own. |
