If You’re Planning to Write Java Code in 2018 Here Are the Trends You Can’t Afford to Miss
2018 is here, and there’s no better time to look back at 2017 and see what was what and what will be it.
2018 is already here, and while it’s been less than a month we can already see interesting trends and features that are about to change the way we write code. That’s why it’s time to look back at 2017 and see which trends are here to stay, and which ones we should keep our eyes on.
Put on your safety gear, we’re going for a ride back to 2017.
Everything you need to know about Java 9
There’s no doubt that 2017 was the year of Java 9, that came to developers 3 years after the initial release of Java 8. The new version experienced a few delays, mainly due to Project Jigsaw that aims to make Java modular.
The project breaks the JRE into interoperable components, allowing developers to use a scaled down runtime Jar (rt.jar) customised to the components a project actually needs. It’s a major change for Java, and one that has been talked about a lot during the past few years.
This project caught a lot of fire, and developers were worried about making the switch to Java 9 and Project Jigsaw. That’s why Mark Reinhold, Chief Architect for the Java Platform Group, decided to put an end to the speculations, and debunked some misconceptions about Jigsaw and Java 9.
However, Jigsaw isn’t the only interesting update that was introduced with Java 9. Another interesting element was a new default garbage collector, the Garbage First Garbage Collector (G1 GC). It’s designed for multi-processor machines with large memories, and supports heaps larger than 4GB. While it is the new default garbage collector, you can always switch to your preferred garbage collector.
Java 9 introduced StackWalker and Stack-Walking API, a class that includes methods that go over the stack, providing us with an overview of the current thread. In other words, it’s a snapshot of a certain stack trace we’re interested in. It also introduced JShell, the first official Java REPL (Read-Eval-Print-Loop), which lets us run a few lines of Java for testing purposes, without wrapping them in a separate project or method.
The new Java version also solves some issues in concurrency and parallelism, as well as offer support for Reactive Streams publish-subscribe framework and improving the CompletableFuture API.
And of course, we can’t forget about the bug in Java 6 that has turned into a feature in Java 9: sun.misc.Unsafe. This library allows low-level, unsafe operations, such as bypassing security checks in a constructor. This is just a small list of what Java 9 has to offer, and you can see the complete list in our Java 9 breakdown.
When taking a wider perspective on time and also looking at the interest Java 8 generated, we’re seeing the following trend:
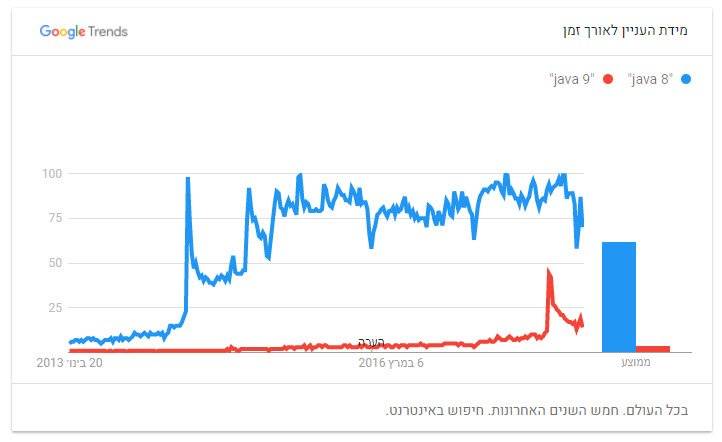
Java 9 is great, but it seems like Java 8 Lambdas generated way more interest than Project Jigsaw and the other interesting features that came with the new version. Also, Java 9 won’t stay in the spotlight for long, due to Oracle’s decision to move towards a faster release cycle, launching Java 10 in just a few weeks.
Deep dive into the logs
A log is a log is a log. Or is it? During the past year, we’ve set out to investigate log files, to try and understand what’s the right way of using them. We had a few key conclusions that might rock your logs, or at least make you think twice about how you’re using them.
We went over Github’s most popular projects and took a deep look into the logging habits of developers. Our first finding was that developers prefer keeping their code clean by using parameterized logging in their log statements.
Looking into the logs, we saw that the most common logged word is “to” and that some developers use the logs to express their feelings by using other words. Along with “Whoops”, “Oooo” and smiley faces, some of the logs are filled with some weird words, curses and other surprising elements.
We’ve also taken a look at how to solve some of the most common Hibernate issues using proper logging, and learned how Viator, a TripAdvisor company, stopped being dependant on 100GB of log files to understand what’s going on in their application.
But the most concerning finding of 2017 was that over 50% of Java logging statements are written wrong. Meaning, these statements have no information about the variable state of the application. We also found out that when it comes to production, 64% of the overall logging statements are deactivated. Yikes.
The rise of CI/CD and short release cycles
Companies are moving faster than usual, introducing frequent releases, constant updates to the product and keeping team members up to date with the newest technology. This need for speed led to the widespread use of continuous integration and continuous delivery practices.
This led to a rise of available methods and tools to apply a CI/CD workflow, all offering a variety of options and features. We’ve taken the top 7 CI/CD tools available on the market and took a deeper look into each one, so you’ll know which tool is the right one for you.
However, it doesn’t matter which tool or method you decided to use, you need to remember that the current CI/CD workflow holds one of the biggest misconceptions in software engineering: it does not end when new code is deployed. The missing link of the CI/CD cycle is monitoring the app, and automated deployments require smarter monitoring.
Can’t forget about the tools
Tools are all around us. We use them for our CI/CD cycles, as part of our monitoring practices or just as a way to keep up with our agile workflow. We’ve covered some interesting tools over the past year, trying to understand what the differences between them and how they can help our different processes.
The first and most known one is Docker, which might be better described as a platform, but we’ve decided to check out the monitoring methods it has to offer. Chris Ward looked at the 5 components of a monitoring stack and taught us how to make logs useful, enhance performance monitoring and error tracking, among other elements.
Speaking of monitoring applications, application failures are unfortunately always happening, and we want to know as soon as they happen. But how can we detect what’s important and what’s not? Through the use of anomaly detection tools. As you can guess, there are a number of tools available in the market, and we mapped out the 5 top tools you need to know about.
Two other popular tools that have been around for a while now are Grafana and Kibana. They both offer data visualization and are seem quite similar, but there’s more to what meets the eye. There are some main differences between them, and identifying them will help you understand which one is right for your visualization needs.
But visualization is not everything, and sometimes it’s all in the basic tools that help us deploy our application. Pivotal Cloud Foundry and Kubernetes are 2 popular cloud deployment platforms, and it’s hard to pick the right one. But, do we really need to choose and use just one of them? The answer might surprise you.
Some tips and tricks up our sleeve
A happy developer is a productive developer. Asking ourselves whether we’re happy or not sounds more philosophical than practical, but it’s an important question we need to answer. During 2017 got a clear understanding of the top 10 reasons that make developers unhappy, and how can it affect our company, application and workflow.
One of the reasons mentioned in the study is bad code quality and coding practices, which can be solved through peer review. On a personal note, 2017 was a meaningful year for us at OverOps, since we introduced peer code review among our R&D team (And also because of our recent major round of funding).
To be honest, this move came after a lot of research on our end, which included talks with other companies, reading case studies and considering various opinions and methods as explained on various websites.
Code review was a big deal for us, and it’s a method that a growing number of companies are embracing as part of their workflow. If you too are considering getting started with code reviews, we’ve collected some concepts and tools that will help you get started.
Focusing on coding practices, one of the methods that have been on the rise during the past year is implementing an exception inbox zero policy. We heard about this practice from engineering teams we spoke to, and it seems like a good practice to follow.
The point of exception inbox zero is to have one single inbox in which we collect, view and handle exceptions, and to that we’ll apply the inbox zero concept, acknowledging each exception, taking care of it and eventually eliminating it.
Another practice that we followed during the past year was to turn our alerts into meaningful ones. Monitoring the application is not enough, and there are specific guidelines and methods we should follow to get the most out of our monitoring techniques, no matter what they are.
We followed a lot of good practices during the past year that helped us be more productive and overall happy, and there’s no doubt will continue following them throughout 2018.
Automate all the things (and the root cause analysis)
During the past year we’ve talked with hundreds, if not thousands, of engineering teams, trying to understand where the common application issues exist. We were able to identify a few similarities, and brought this new-found knowledge into writing.
The bottom line was that monitoring our application is a hard job, and it requires processes and tools in order for us to do it right. From that realization and those talks with engineering teams we created the ideal Java production monitoring stack.
At this point we realized that there must be a better way to monitor our application, and that the answer lies within the root cause. There’s no doubt that we all want to get to the root cause of issues, errors or exceptions within our system, but it’s hard to put our finger on what exactly we’re looking from.
That’s why we decided to turn root cause analysis into an automatic process, showing the complete data needed to identify, understand and solve issues. OverOps ARC AI (automatic root cause) analyzes application code in real-time and deliver the complete source code, variables, DEBUG logs and JVM state behind any error. Check it out.
We talked with companies such as TripAdvisor, Intuit, Comcast, Zynga and others to learn how they automate their error resolution workflows. We learned that with automated root cause analysis, their time spent on identifying and solving production errors within Java applications was cut down from days to minutes.
Final thoughts
2017 was a busy year, but it feels like we’re saying that every year. There are a lot of methods, workflows and best practices we’ve embraced during the past year, and we don’t doubt they’ll continue with us well into 2018.
If we had to guess, 2018 will be the year of AI, automation and making tools and practices work for us. This year, we’ll be able to focus on writing code, advancing the application and creating new features.
What were your 2017 trends that will follow you into 2018? We would love to hear about them in the comments!
| Published on Java Code Geeks with permission by Henn Idan, partner at our JCG program. See the original article here: If You’re Planning to Write Java Code in 2018 Here Are the Trends You Can’t Afford to Miss Opinions expressed by Java Code Geeks contributors are their own. |
