This article is part of our Academy Course titled Docker Tutorial for Java Developers.
In this course, we provide a series of tutorials so that you can develop your own Docker based applications. We cover a wide range of topics, from Docker over command line, to development, testing, deployment and continuous integration. With our straightforward tutorials, you will be able to get your own projects up and running in minimum time. Check it out here!
Table Of Contents
1. Introduction
In the last part of the tutorial we learned a number of ways to package (and run) Java applications as Docker containers. In this part we are going to focus more on how Docker impacts our development practices in a quite positive ways.
Fairly speaking, there are a lot of areas where Docker could be very helpful for developers. The emphasis of our discussion will be made on Docker integration with IDEs, running IDEs as Docker containers and getting to know a couple of useful tools for managing and monitoring your Docker environments.
2. Docker from your IDE
As we have seen so far, Docker’s command line tools are very powerful and their usage is pretty straightforward. However, most of us, developers, spend major part of the day in our favorite IDE. Switching between dozens of windows and terminals in the middle of the debugging session while hunting for a hard to reproduce bug in the application logic could be quite counterproductive.
Luckily, all three leading Java development IDEs, namely Eclipse, JetBrains IntelliJ IDEA and NetBeans, provide integration with Docker tooling through convenient UI views or/and widgets. Let us quickly go over each of these IDEs and take a closer look on what one has to offer.
2.1. Eclipse
Eclipse Oxygen, the latest released version of Eclipse IDE as of this moment, has comprehensive Docker tooling support provided by Linux Tools subproject (available as a plugin). Once installed, it contributes four additional views under Docker category.
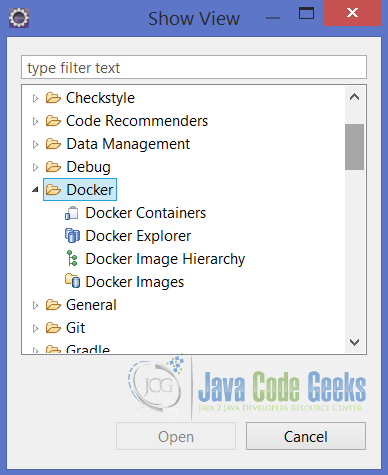
Each of these views exposes some details about Docker containers or images, with Docker Explorer being all-in-one view of both.

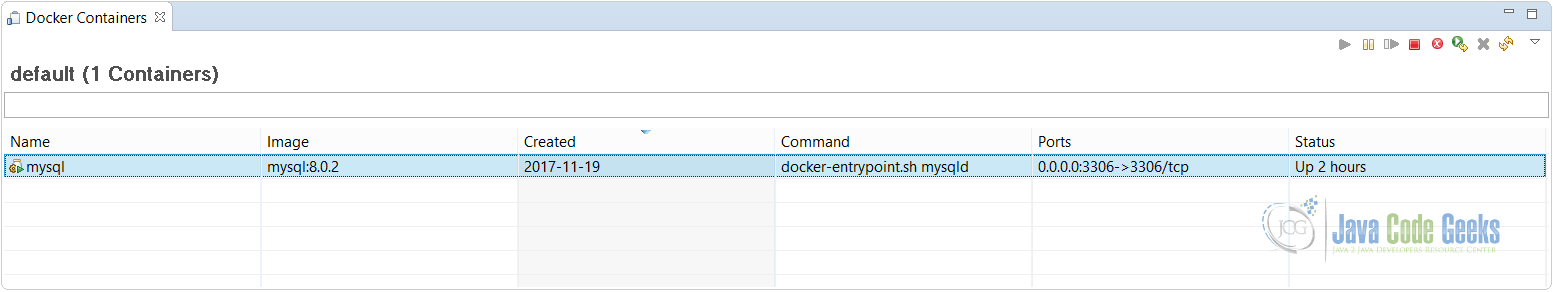
If you are interested just in Docker containers, there is a dedicated Docker Containers view, which uses compact, table-based representation.
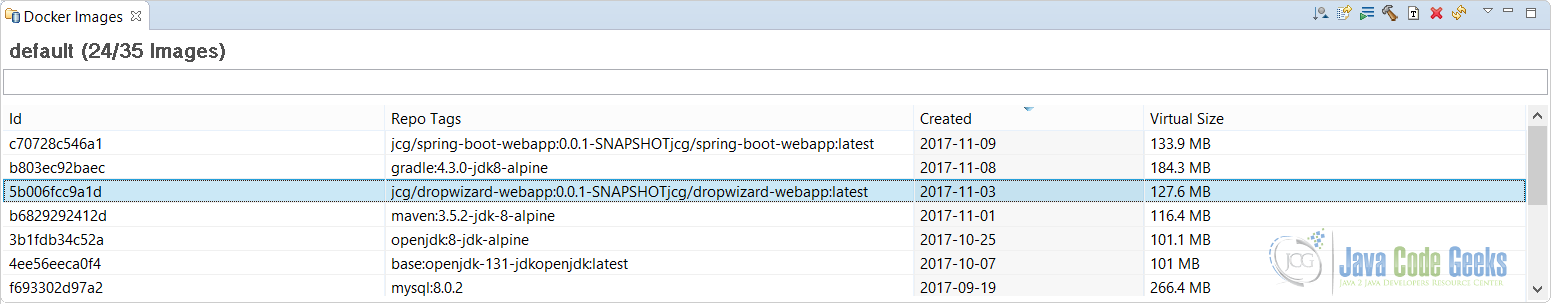
Similarly, if you want to list only Docker images, the specialized Docker Images view is right here to serve your needs.
Last but not least, there is one very useful view called Docker Image Hierarchy. It allows to see all the layers the image in question has been built from. Here, for example, we could see how the tagged image with name jcg/spring-boot-webapp:0.0.1-SNAPSHOT (one of the samples we were building in the previous part of the tutorial) is layered out.

But these views are only the part of the whole story. Another part is a set of new Docker launchers which you may use to build Docker images and run your Java applications (or even complete Docker Compose stacks) as Docker containers.
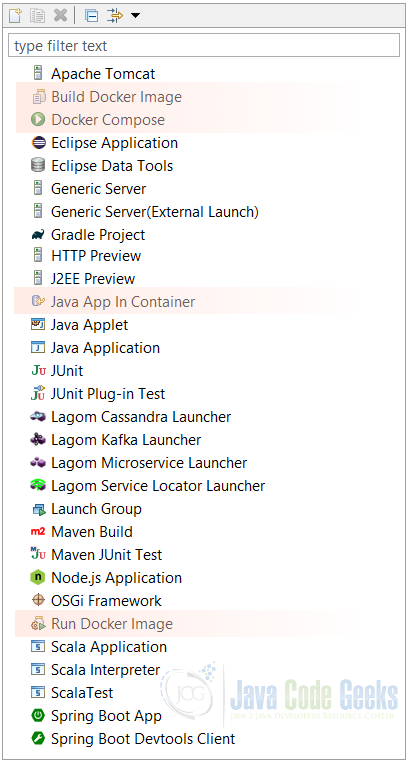
In case you would like to learn more about all the views and launchers discussed above, and, in general, about Docker tooling available in Eclipse, the official project Wiki is a great place to get started.
2.2. IntelliJ IDEA
The JetBrains IntelliJ IDEA, available in latest version 2017.2.6, provides the Docker tooling support in a form of the official plugin. It is available in Ultimate Edition as well as in Community Edition, which we are going to use in this section.
Once the plugin is installed, the new Docker view becomes available, with all the details about images and containers baked in.
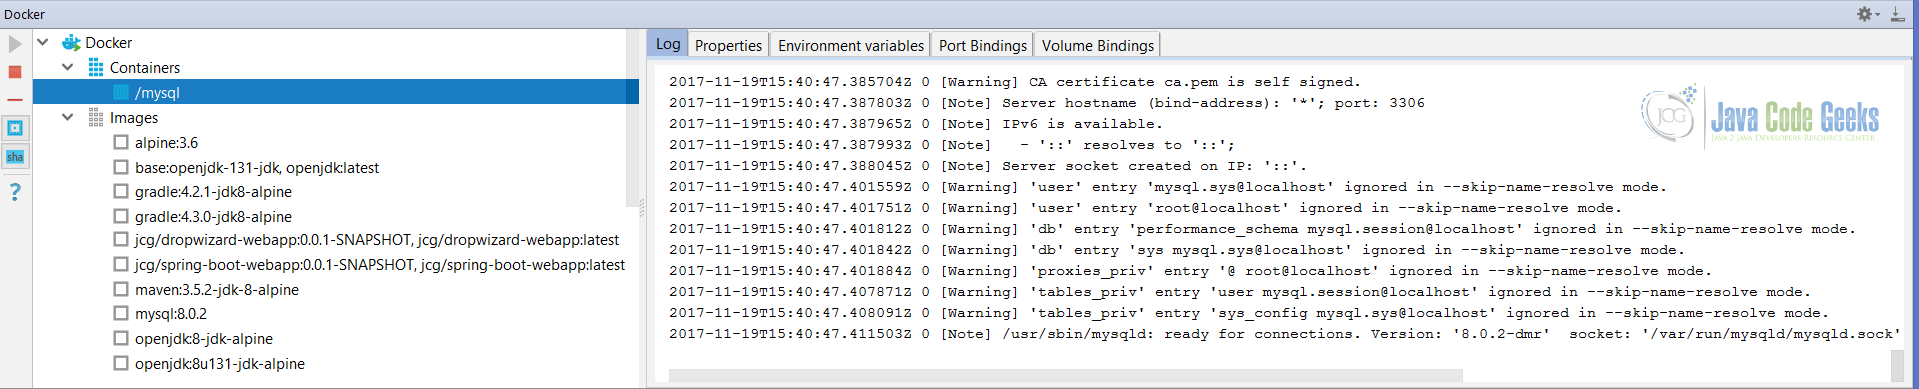
To be fair, having a single, nicely structured view with most of the required pieces available nearby (in the different tabs) is very convenient.
2.3. Oracle NetBeans
The NetBeans since the latest 8.2 release has Docker tooling included as part of the Base IDE plugin (which you very likely would have activated from the start). After the plugin activation, the addition Docker tree node becomes available in the Services view.
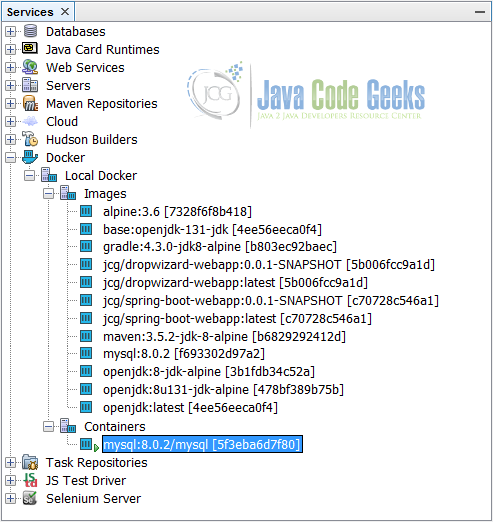
A quite nice summary and discussions about desired features regarding Docker integration in NetBeans has been published on official community Wiki. Please check it out if you are curious or interested in this topic.
3. On the Edge: Your IDE in Docker
As we have seen, the Docker tooling provided by most popular Java development IDEs is quite sufficient, one may say even outstanding. But what if we try to push the limits and run our IDE completely in Docker, literally anywhere? If it sounds a bit crazy, it surely does, but …
Eclipse Che, the next-generation IDE from Eclipse, is leveraging containerization at full extent and runs completely on Docker. Under the hood, it is powered by REST(ful) web APIs and provides feature-rich, browser-based IDE.
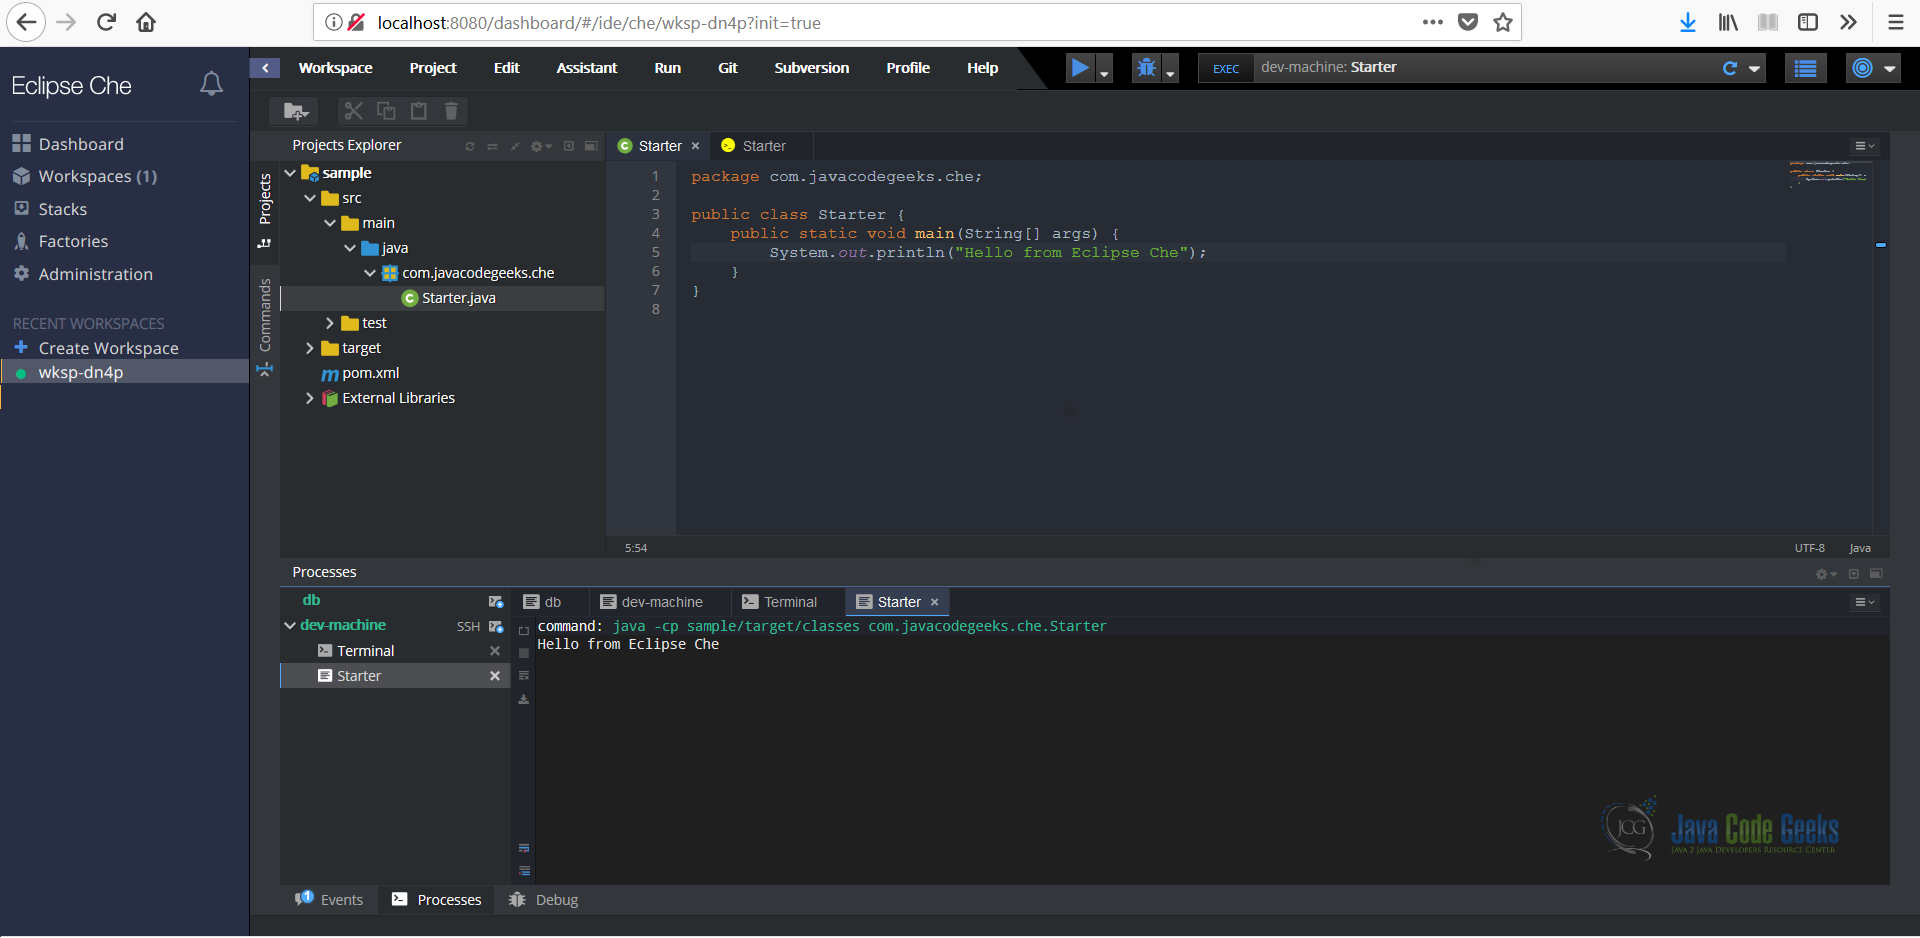
It is quite innovative and young project, with a tremendous potential to revolutionize the concepts of IDEs as we know them. It would be very interesting to see how things are going to unfold in the future but the technology is already here, available for evaluation.
4. So What About Debugging?
Debugging was, is and very likely will be playing the crucial role in finding, understanding and resolving defects or problems in our programs. And, like it or not, no matter how awesome Docker is, it won’t make our applications free from bugs. If you are running your Java applications as Docker containers, the debugging process changes a little bit, and is explained in great details in this excellent article. It is so comprehensive that there no need to repeat it here, just pick the IDE you use and go over handsome tutorials prepared for you.
5. Management and Monitoring
Although Docker command line tools and, consequently, Docker Engine APIs, let you accomplish any task you may encounter, many of us still prefer to deal with some kind of web or graphical UIs. Obviously, this is a personal preference and in this section we are going to learn about quite a few interesting options in this regards.
5.1. Portainer
The first tool we a going to look at is Portainer, an open-source lightweight management UI which allows to easily manage different Docker environments (like Docker hosts or Docker Swarm clusters). It comes as no surprise that Portainer itself runs as a lightweight Docker container. Let us run one:
$ docker run -d -p 9000:9000 -v /var/run/docker.sock:/var/run/docker.sock portainer/portainer
On Windows machine, the command looks a little bit different:
$ docker run -d -p 9000:9000 portainer/portainer
Once the Portainer container is up and running, you will be able to access it through pretty neat web UI available at http://localhost:9000 (or, in case you are using non-native Docker installation, http://<docker-machine>:9000).
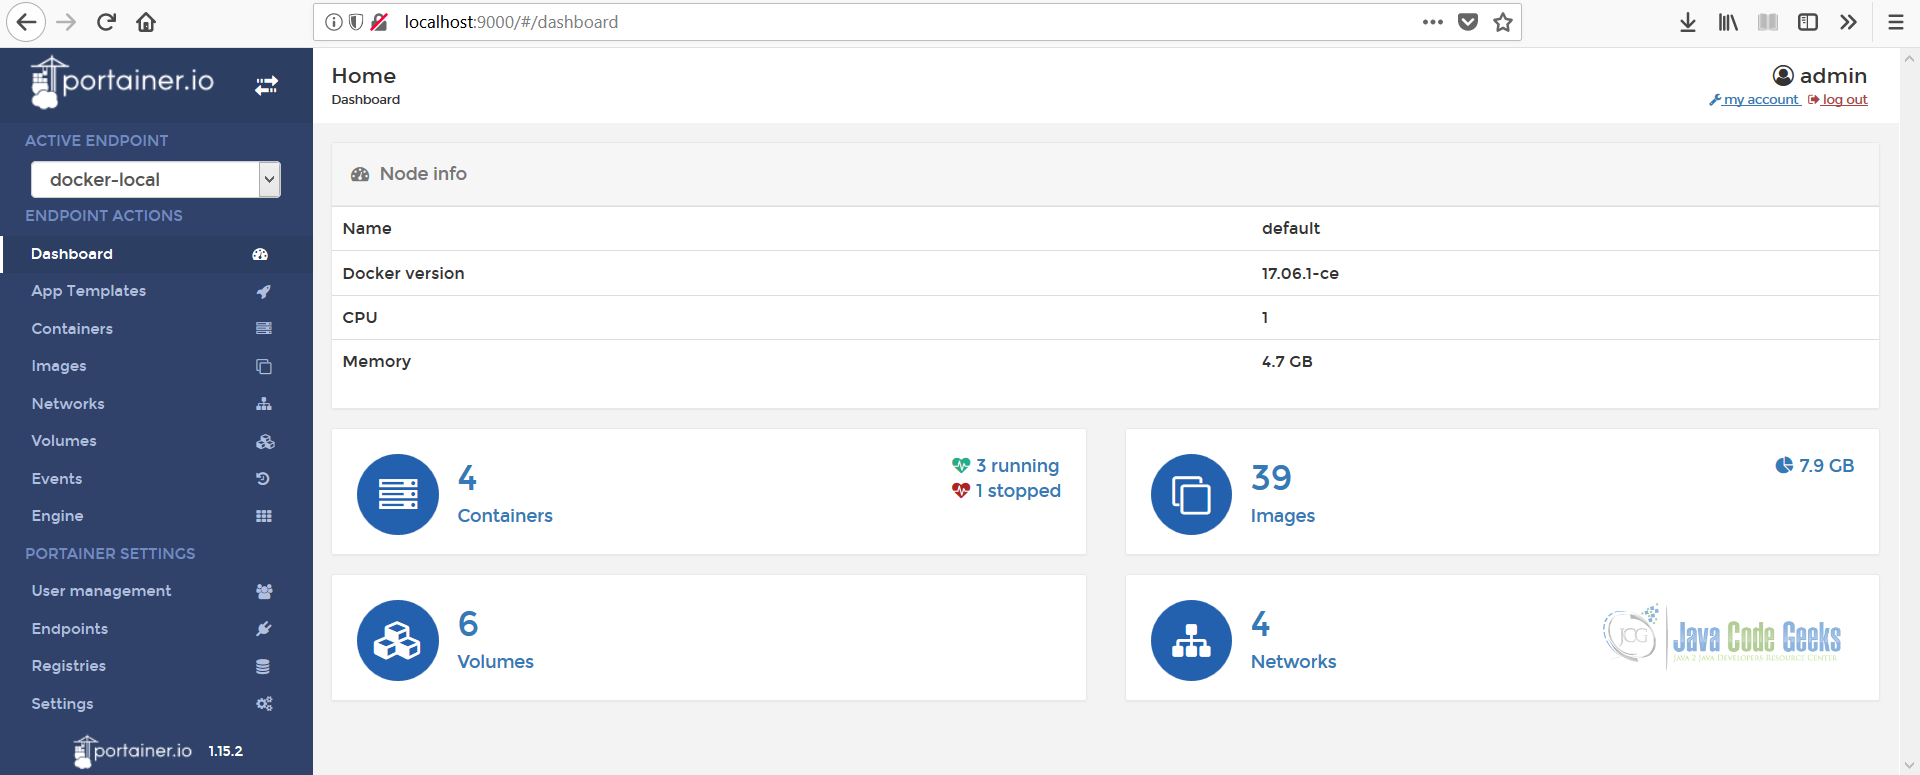
When the setup steps are completed (if necessary), you are going to be navigated to all-in-one view of the Docker environment in question, starting from the simple dashboard page. You will definitely recognize all the Docker objects (like volumes, networks, containers, images, …) listed on the left so you could select any of those in order to be redirected to a dedicated view.
The list of supported Docker features which Portainer exposes through the intuitive web interface is just astonishing. If you favor UI tools over command line ones, Portainer has all the chances to serve as the one-stop shop for you.
5.2. cAdvisor
Often while we are developing our applications there is a need to get more insights regarding what is going on with our containers, either we are talking about CPU, memory or network utilization. Luckily, there are quite a few options here and one of the very useful tools we are going to talk about is cAdvisor (or in full version, container advisor) which analyzes the resource usage and performance characteristics of running containers.
“cAdvisor provides container users an understanding of the resource usage and performance characteristics of their running containers. It is a running daemon that collects, aggregates, processes, and exports information about running containers. Specifically, for each container it keeps resource isolation parameters, historical resource usage, histograms of complete historical resource usage and network statistics. This data is exported by container and machine-wide.” – https://github.com/google/cadvisor
Interestingly, cAdvisor goes beyond just Docker and should support just about any other container type out of the box. Sadly for Windows users, cAdvisor has limited support on this platform. The best way to give the cAdvisor a try is, for sure, to run it as Docker container.
sudo docker run \
  --volume=/:/rootfs:ro \
  --volume=/var/run:/var/run:rw \
  --volume=/sys:/sys:ro \
  --volume=/var/lib/docker/:/var/lib/docker:ro \
  --volume=/dev/disk/:/dev/disk:ro \
  --publish=8080:8080 \
  --detach=true \
  --name=cadvisor \
  google/cadvisor:latest
Once the container is up and running, you can access cAdvisor web UI at http://localhost:8080 (or, in case you are using non-native Docker installation, http://<docker-machine>:8080).
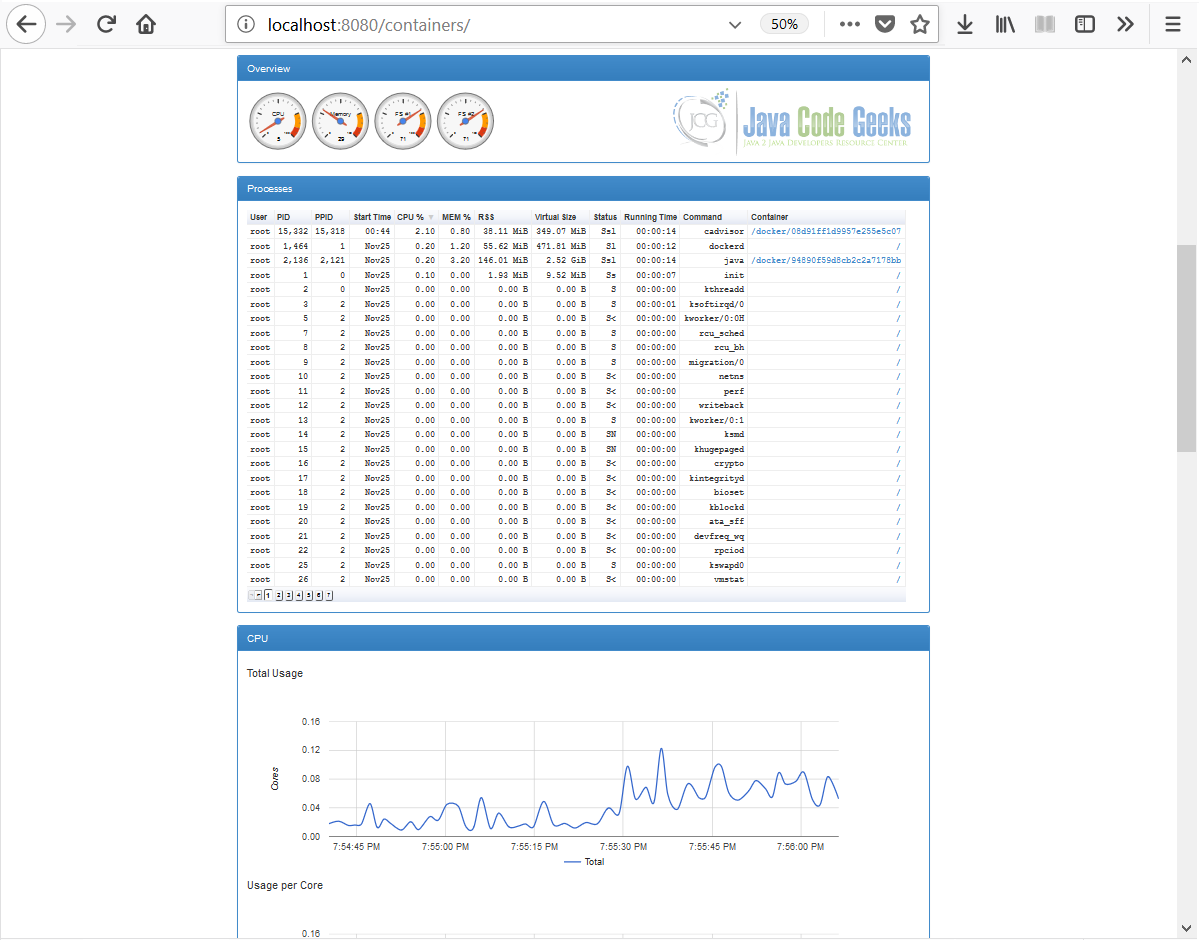
The web UI is quite simple but exceptionally informative. There are a lot of details collected about resources and processes of each running Docker container as well as about the Docker host machine itself (CPU, memory, network, storage, …). By all means, it is invaluable tool to learn how your containers consume and manage the resources at runtime.

5.3. ctop
And last, but not least, we are going to wrap up with ctop tool which, in a top-like interface, provides a concise and condensed overview of real-time metrics for multiple containers.

Not only ctop has a summary view, it also supports the option to select and focus on any individual container as well.
5.4. And a lot more …
The Docker tooling space is really thriving, with new interesting projects popping up literally every day. We have just covered a couple of well-known, mature and useful tools but there are a lot more to discover, so please watch this space closely if you are interested.
6. Docker Engine Metrics
Docker engine exposes a lot of interesting metrics in the format which is fully compatible with Prometheus, tremendously popular open-source monitoring and alerting solution. Although this feature became generally available quite a while ago, not many people know about it and as such, not many make use of it.
This feature is still considered experimental so it is not available by default and needs a bit of configuration tweaking. The official documentation thoroughly describes all the necessary steps to be done with respect to the operating system you are running Docker on. But essentially, the first step is to modify daemon.json and add the following properties there.
{
  "metrics-addr" : "localhost:9323",
  "experimental" : true
}
In order for this change to take effect, the Docker daemon should be restarted. Right after, the metrics should become available at the http://localhost:9323/metrics endpoint. Next step is to prepare Prometheus configuration, prometheus.yml, in order to scrape the Docker engine metrics.
scrape_configs:
  - job_name: 'prometheus'
    static_configs:
      - targets: ['localhost:9090']
  - job_name: 'docker'
    static_configs:
      - targets: ['localhost:9323']
With this minimal configuration in hand we could start the Prometheus server (which has reached version 2.0 as of moment of this writing) as Docker container:
docker run -p 9090:9090 \
    -v prometheus.yml:/etc/prometheus/prometheus.yml \
    prom/Prometheus
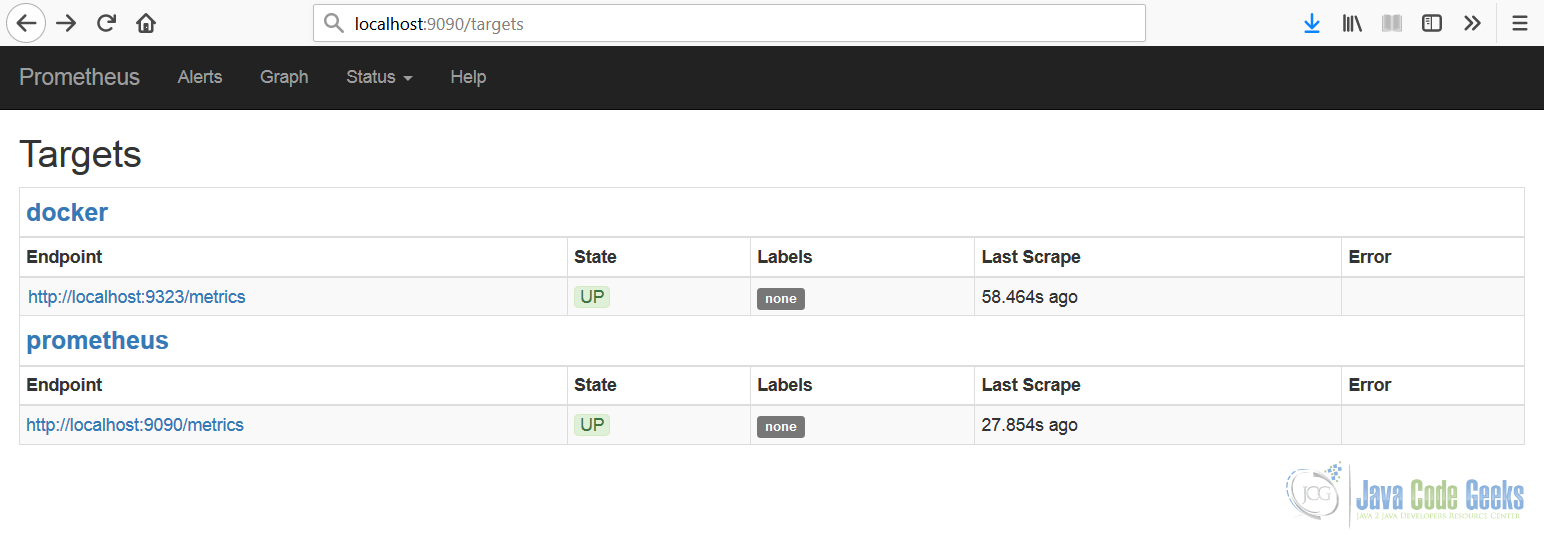
Once the container is started, the Prometheus web UI should be available at http://localhost:9090. Let us navigate to this URL and check that all targets we have configured are accessible.
Fairly speaking, the Prometheus web UI is quite capable to graph different metrics but Grafana, another open-source project, is the state of the art platform to query, visualize, alert on and understand the metrics.
docker run -d -p 3000:3000 \
    -e "GF_SECURITY_ADMIN_PASSWORD=pa$$w0rd" \
    grafana/grafana
Grafana has a huge list of prebuilt dashboards and one of them, the Docker Engine Metrics dashboard, is exactly what we are looking for. Here is the sneak peek on how it shows up (beautiful, indeed).
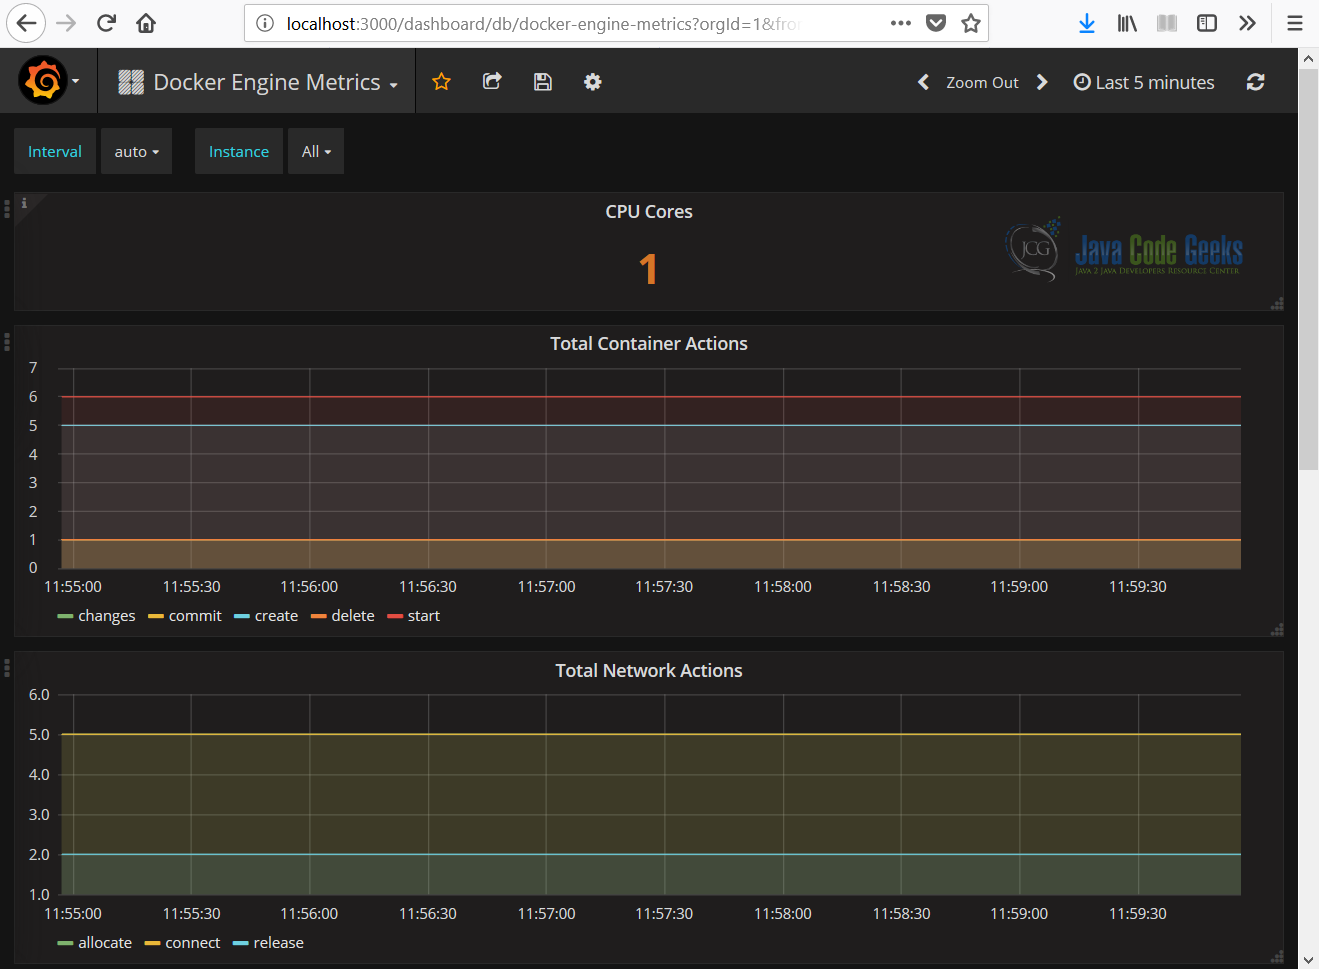
It may not look very meaningful at first glance but you are free to modify it or even build your own, choosing just the Docker engine metrics you are interested in.
7. Conclusions
In this section of the tutorial we have talked about how developer’s best friends, the IDEs, keep abreast of the times by providing extensive Docker tooling and support. Beyond just that, we have also mentioned a couple of very useful tools for managing and monitoring your containers and Docker engine itself.
8. What’s next
In the next section of the tutorial we are going to talk about using Docker for testing, particularly in context of doing integration and end-to-end tests of our Java applications.