Up till now, when you would ask me that same question, I would tell you about how Activiti minimizes database access in every way possible, how we break down the process structure into an ‘execution tree’ which allows for fast queries or how we leverage ten years of workflow framework development knowledge.
You know, trying to get around the question without answering it. We knew it is fast, because of the theoretical foundation upon which we have built it. But now we have proof: real numbers …. Yes, it’s going to be a lengthy post. But trust me, it’ll be worth your time!
Disclaimer: performance benchmarks are hard. Really hard. Different machines, slight different test setup … very small things can change the results seriously. The numbers here are only to prove that the Activiti engine has a very minimal overhead, while also integrating very easily into the Java eco-system and offering BPMN 2.0 process execution.
The Activiti Benchmark Project
To test process execution overhead of the Activiti engine, I created a little side project on github: https://github.com/jbarrez/activiti-benchmark
The project contains currently 9 test processes, which we’ll analyse below. The logic in the project is pretty straightforward:
- A process engine is created for each test run
- Each of the processes are sequentially executed on this process engine, using a threadpool from 1 up to 10 threads.
- All the processes are thrown into a bag, of which a number of random executions are drawn.
- All the results are collected and a HTML report with some nice charts are generated
To run the benchmark, simply follow the instructions on the github page to build and execute the jar.
Benchmark Results
The test machine I used for the results is my (fairly old) desktop machine: AMD Phenom II X4 940 3.0Ghz, 8 Gb 800Mhz RAM and an old-skool 7200 rpm HD running Ubuntu 11.10. The database used for the test runs on the same machine on which the tests also run. So keep in mind that in a ‘real’ server environment the results could even be better!
The benchmark project I mentioned above, was executed on a default Ubuntu MySQL 5 database. I just switched to the ‘large.cnf’ setting (which throws more RAM at the db and stuff like that) instead the default config.
- Each of the test processes ran for 2500 times, using a threadpool going from one to ten threads. In simpleton language: 2500 process executions using just one thread, 2500 threads using two threads, 2500 process executions using three … yeah, you get it.
- Each benchmark run was done using a ‘default’ Activiti process engine. This basically means a ‘regular’ standalone Activiti engine, created in plain Java. Each benchmark run was also done in a ‘Spring’ config. Here, the process engine was constructed by wrapping it in the factory bean, the datasource is a Spring datasource and also the transactions and connection pool is managed by Spring (I’m actually using a tweaked BoneCP threadpool)
- Each benchmark run was executed with history on the default history level (ie. ‘audit’) and without history enabled (ie. history level ‘none’).
The processes are in detail analyzed in the sections below, but here are the integral results of the test runs already:
- Activiti 5.9 – MySQL – default – history enabled
- Activiti 5.9 – MySQL – default – history disabled
- Activiti 5.9 – MySQL – Spring – history enabled
- Activiti 5.9 – MySQL – Spring – history disabled
I ran all the tests using the latest public release of Activiti, being Activiti 5.9. However, my test runs brought some potential performance fixes to the surface (I also ran the benchmark project through a profiler). It was quickly clear that most of the process execution time was done actually cleaning up when a process ended. Basically, more than often queries were fired which were not necessary if we would save some more state in our execution tree. I sat together with Daniel Meyer from Camunda and my colleague Frederik Heremans, and they’ve managed to commit fixes for this! As such, the current trunk of Activiti, being Activiti 5.10-SNAPSHOT at the moment, is significantly faster than 5.9.
- Activiti 5.10 – MySQL – default – history enabled
- Activiti 5.10 – MySQL – default – history disabled
- Activiti 5.10 – MySQL – Spring – history enabled
- Activiti 5.10 – MySQL – Spring – history disabled
From a high-level perspective (scroll down for detailed analysis), there are a few things to note:

- I had expected some difference between the default and Spring config, due to the more ‘professional’ connection pool being used. However, the results for both environments are quite alike. Sometimes the default is faster, sometimes Spring. It’s hard to really find a pattern. As such, I omitted the Spring results in the detailed analyses below.
- The best average timings are most of the times found when using four threads to execute the processes. This is probably due to having a quad-core machine.
- The best throughput numbers are most of the times found when using eight threads to execute the processes. I can only assume that is also has something to do with having a quad-core machine.
- When the number of threads in the threadpool go up, the throughput (processes executed / second) goes up, both it has a negative effect on the average time. Certainly with more than six or seven threads, you see this effect very clear. This basically means that while the processes on itself take a little longer to execute, but due to the multiple threads you can execute more of these ‘slower’ processes in the same amount of time.
- Enabling history does have an impact. Often, enabling history will double execution time. This is logical, given that many extra records are inserted when history is on the default level (ie. ‘audit’).
There was one last test I ran, just out of curiosity: running the best performing setting on an Oracle XE 11.2 database. The Oracle XE is a free version of the ‘real’ Oracle database. No matter how hard, I tried, I couldn’t get it decently running on Ubuntu. As such, I used an old Windows XP install on that same machine. However, the OS is 32 bit, wich means the system only has 3.2 of the 8Gb of RAM available. Here are the results:
The results speak for itself. Oracle blows away any of the (single-threaded) results on MySQL (and they are already very fast!). However, when going multi-threaded it is far worse than any of the MySQL results. My guess is that these are due to the limitations of the XE version: only one CPU is used, only 1 GB of RAM, etc. I would really like to run these test on a real Oracle-managed-by-a-real-DBA … Feel free to contact me if you are interested!
In the next sections, we will take a detailed look into the performance numbers of each of the test processes. An Excel sheet containing all the the numbers and charts below can be downloaded for yourself.
Process 1: The bare micromum (one transaction)

The first process is not a very interesting one, business-wise at least. After starting the process, the end is immediately reached. Not very useful on itself, but its numbers learn us one essential thing: the bare overhead of the Activiti engine. Here are the average timings:

This process runs in a single transaction, which means that nothing is saved to the database when the history is disabled due to Activiti’s optimizations. With history enabled, you’ll basically get the cost for inserting one row into the historical process instance table, which is around 4.44 ms here. It is also clear that our fix for Activiti 5.10 has an enormous impact here. In the previous version, 99% of the time was spent in the cleanup check of the process. Take a look at the best result here: 0.47 ms when using 4 threads to execute 2500 runs of this process. That’s only half a millisecond! It’s fair to say that the Activiti engine overhead is extremely small.
The throughput numbers are equally impressive:

In the best case here, 8741 processes are executed. Per second. By the time you arrive here reading the post, you could have executed a few millions of this process ![]() . You can also see that there is little difference between 4 or 8 threads here. Most of the execution time here is cpu time, and no potential collisions such as waiting for a database lock happens here.
. You can also see that there is little difference between 4 or 8 threads here. Most of the execution time here is cpu time, and no potential collisions such as waiting for a database lock happens here.
In these numbers, you can also easily see that the Oracle XE doesn’t scale well with multiple threads (which is explained above). You will see the same behavior in the following results.
Process 2: The same, but a bit longer (one transaction)

This process is pretty similar to the previous one. We have again only one transaction. After the process is started, we pass through seven no-op passthrough activities before reaching the end.

Some things to note here:
- The best result (again 4 threads, with history disabled) is actually better than the simpler previous process. But also note that the single threaded execution is a tad slower. This means that the process on itself is a bit slower, which is logical as is has more activities. But using more threads and having more activities in the process does allow for more potential interleaving. In the previous case, the thread was barely born before it was killed again.
- The difference between history enabled/disabled is bigger than the previous process. This is logical, as more history is written here (for each activity one record in the database).
- Again, Activiti 5.10 is far more superior to Activiti 5.9.
The throughput numbers follow these observations: there is more opportunity to use threading here. The best result lingers around 12000 process execution per second. Again, it demonstrates the very lightweight execution of the Activiti engine.

Process 3: Parallelism in one transaction

This process executes a parallel gateway that forks and one that joins in the same transaction. You would expect something along the lines of the previous results, but you’d be surprised:

Comparing these numbers with the previous process, you see that execution is slower. So why is this process slower, even if it has less activities? The reason lies with how the parallel gateway is implemented, especially the join behavior. The hard part, implementation-wise, is that you need to cope with the situation when multiple executions arrive at the join. To make sure that the behavior is atomic, we internally do some locking and fetch all child executions in the execution tree to find out whether the join activates or not. So it is quite a ‘costly’ operation, compared to the ‘regular’ activities.
Do mind, we’re talking here about only 5 ms single threaded and 3.59 ms in the best case for MySQL. Given the functionality that is required for implementing the parallel gateway functionality, this is peanuts if you’d ask me.
The throughput numbers:

This is the first process which actually contains some ‘logic’. In the best case above, it means 1112 processes can be executed in a second. Pretty impressive, if you’d ask me!.
Process 4: Now we’re getting somewhere (one transaction)

This process already looks like something you’d see when modeling real business processes. We’re still running it in one database transaction though, as all the activities are automatic passthroughs. Here we also have two forks and two joins.

Take a look at the lowest number: 6.88 ms on Oracle when running with one thread. That’s freaking fast, taking in account all that is happening here. The history numbers are at least doubled here (Activiti 5.10), which makes sense because there is quite a bit of activity audit logging going on here. You can also see that this causes to have a higher average time for four threads here, which is probably due to the implementation of the joining. If you know a bit about Activiti internals, you’ll understand this means there are quite a bit of executions in the execution tree. We have one big concurrent root, but also multiple children which are sometimes also concurrent roots.
But while the average time rises, the throughput definitely benefits:

Running this process with eight threads, allows you to do 411 runs of this process in a single second.
There is also something peculiar here: the Oracle database performs better with more thread concurrency. This is completely contrary with all other measurements, where Oracle is always slower in that environment (see above for explanation). I assume it has something to do with the internal locking and forced update we are applying when forking/joining, which is better handled by Oracle it seems.
Process 5: Adding some Java logic (single transaction)

I added this process to see the influence of adding a Java service task in a process. In this process, the first activity generates a random value, stores it as a process variable and then goes up or down in the process depending on the random value. The chance is about 50/50 to go up or down.

The average timings are very very good. Actually, the results are in the same range as those of process 1 and 2 above (which had no activities or only automatic passthroughs). This means that the overhead of integrating Java logic into your process is nearly non-existant (nothing is of course for free). Of course, you can still write slow code in that logic, but you can’t blame the Activiti engine for that ![]()
Throughput numbers are comparable to those of process 1 and 2: very, very high. In the best case here, more than 9000 processes are executed per second. That indeed also means 9000 invocations of your own Java logic.

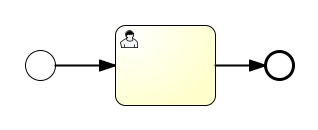
Process 6, 7 and 8: adding wait states and transactions
The previous processes demonstrated us the bare overhead of the Activiti engine. Here, we’ll take a look at how wait states and multiple transactions have influence on performance. For this, I added three test processes which contain user tasks. For each user task, the engine commits the current transaction and returns the thread to the client. Since the results are pretty much compatible for these processes, we’re grouping them here. These are the processes:


Here are the average timings results, in order of the processes above. For the first process, containing just one user task:

It is clear that having wait states and multiple transaction does have influence on the performance. This is also logical: before, the engine could optimize by not inserting the runtime state into the database, because the process was finished in one transaction. Now, the whole state, meaning the pointers to where you are currently, need to be saved into the database. The process could be ‘sleeping’ like this for many days, months, years now …. The Activiti engine doesn’t hold it into memory now anymore, and it is freed to give its full attention to other processes.
If you check the results of the process with only one user task, you can see that in the best case (Oracle, single thread – the 4 threads on MySQL is pretty close) this is done in 6.27ms. This is really fast, if you take in account we have a few inserts (the execution tree, the task), a few updates (the execution tree) and deletes (cleaning up) going on here.
The second process here, with 7 user tasks:

The second chart learns us that logically, more transactions means more time. In the best case here the process is done in 32.12 ms. That is for seven transactions, which gives 4.6 ms for each transactions. So it is clear that average time scales in a linearly way when adding wait states. This makes of course sense, because transactions aren’t free.
Also note that enabling history does add quite some overhead here. This is due to having the history level set to ‘audit’, which stores all the user task information in the history tables. This is also noticeable from the difference between Activiti 5.9 with history disabled and Activiti 5.10 with history enabled: this is a rare case where Activiti 5.10 with history enabled is slower than 5.9 with history disabled. But it is logical, given the volume of history stored here.
And the third process learns us how user tasks and parallel gateways interact:

The third chart learns us not much new. We have two user tasks now, and the more ‘expensive’ fork/join (see above). The average timings are how we expected them.
The throughput charts are as you would expect given the average timings. Between 70 and 250 processes per second. Aw yeah!
To save some space, you’ll need to click them to enlarge:


Process 9: So what about scopes?

For the last process, we’ll take a look at ‘scopes’. A ‘scope’ is how we call it internally in the engine, and it has to do with variable visibility, relationships between the pointers indicating process state, event catching, etc. BPMN 2.0 has quite some cases for those scopes, for example with embedded subprocesses as shown in the process here. Basically, every subprocess can have boundary events (catching an error, a message, etc) that only are applied on its internal activities when it’s scope is active. Without going into too much technical details: to get scopes implemented in the correct way, you need some not so trivial logic.
The example process here has 4 subprocesses, nested in each other. The inner process is using concurrency, which is a scope on itself again for the Activiti engine. There are also two user tasks here, so that means two transactions. So let’s see how it performs:

You can clearly see the big difference between Activiti 5.9 and 5.10. Scopes are indeed an area where the fixes around the ‘process cleanup’ at the end have a huge benefit, as many execution objects are created and persisted to represent the many different scopes. Single threaded performance is not so good on Activiti 5.9. Luckily, as you can see from the gap between the blue and the red bars, those scopes do allow for high concurrency.
The numbers of Oracle, combined with the multi-threaded results of the 5.10 tests, do prove that scopes are now efficiently handled by the engine. The throughput charts prove that the process nicely scales with more threads, as you can see by the big gap between the red and green line in the second last block. In the best case, 64 processes of this more complex process are handled by the engine.

Random execution
If you have already clicked on the full reports at the beginning of the post, you probably have noticed also random execution is tested for each environment. In this setting, 2500 process executions were done, both the process was randomly chosen. As shown in those reports this meant that over 2500 executions, each process was executed almost the same number of times (normal distribution).
This last chart shows the best setting (Activiti 5.10, history disabled) and how the throughput of those random process executions goes when adding more threads:

As we’ve seen in many of the test above, once passed four threads things don’t change that much anymore. The numbers (167 processes/second) prove that in a realistic situation (ie. multiple processes executing at the same time), the Activiti engine nicely scales up. Conclusion
The average timing charts show two things clearly:
- The Activiti engine is fast and overhead is minimal!
- The difference between history enabled or disabled is definitely noticeably. Sometimes it comes even down to half the time needed. All history tests were done using the ‘audit’ level, but there is a simpler history level (‘activity’) which might be good enough for the use case. Activiti is very flexible in history configuration, and you can tweak the history level for each process specifically. So do think about the level your process needs to have, if it needs to have history at all!
The throughput charts prove that the engine scales very well when more threads are available (ie. any modern application server). Activiti is well designed to be used in high-throughput and availability (clustered) architectures.
As I said in the introduction, the numbers are what they are: just numbers. My main point which I want to conclude here, is that the Activiti engine is extremely lightweight. The overhead of using Activiti for automating your business processes is small. In general, if you need to automate your business processes or workflows, you want top-notch integration with any Java system and you like all of that fast and scalable … look no further!
Reference: The Activiti Performance Showdown from our JCG partner Joram Barrez at the Small steps with big feet blog.

Thank you for this in-depth benchmark analysis! I am looking at adopting Activiti and this helps me feel more comfortable with the performance question!