Apache Drill has a hidden gem: an easy to use REST interface. This API can be used to Query, Profile and Configure Drill engine.
In this blog post I will explain how to use Drill REST API to create ascii dashboards using Blessed Contrib.
The ASCII Dashboard looks like:

Prerequisites
- Node.js
- Apache Drill 1.2
- For this post, you will use the SFO Passengers CSV file available here.
- Download this locally, unzip the files and put the CSV into a folder that will be access using the following path in Drill :
dfs.data.`/airport/*.csv`
- Download this locally, unzip the files and put the CSV into a folder that will be access using the following path in Drill :
Note: I am still using Apache 1.2 to allow this example to be executed in context of a MapR cluster.
The Query and View
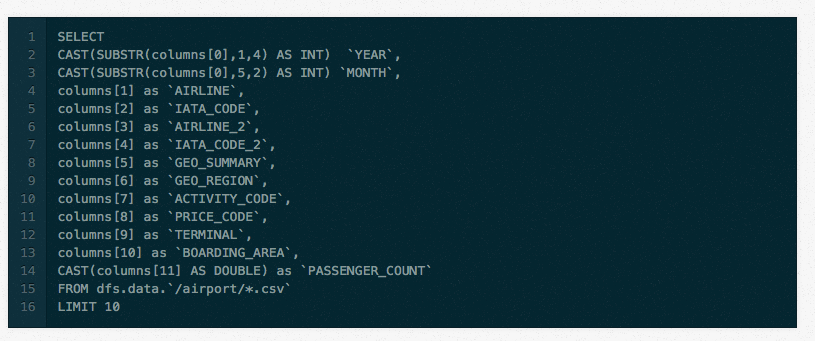
In Drill 1.2, CSV headers are not automatically parsed. (This is one of the new features of 1.3: look for extractHeader in the documentation).
For simplicity, remove the first line of the CSV.
The basic query will look like:
Let’s now create a view with these columns: (do not put any limit !)
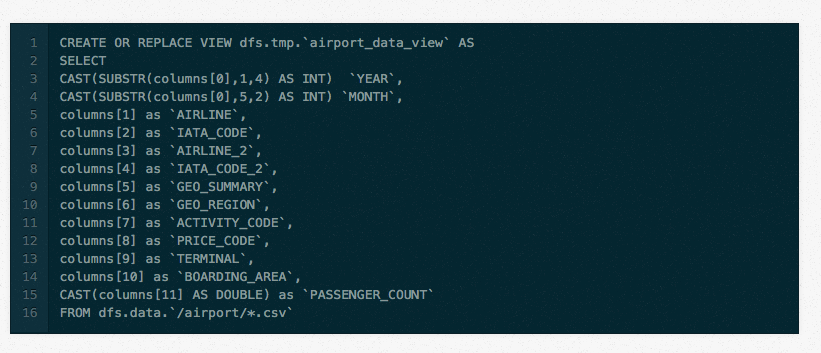
So you can now use the view in your query:

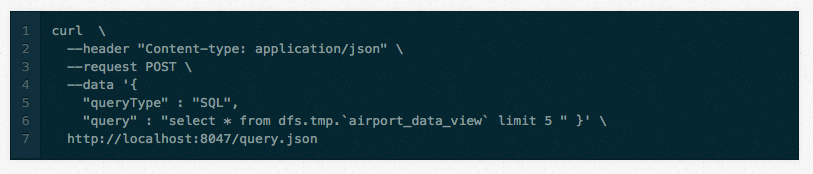
Use the REST API
Now that you have the query you can use the REST API to retrieve the data as JSON document over HTTP. Open a terminal and run this curl command:
The returned JSON document looks like:
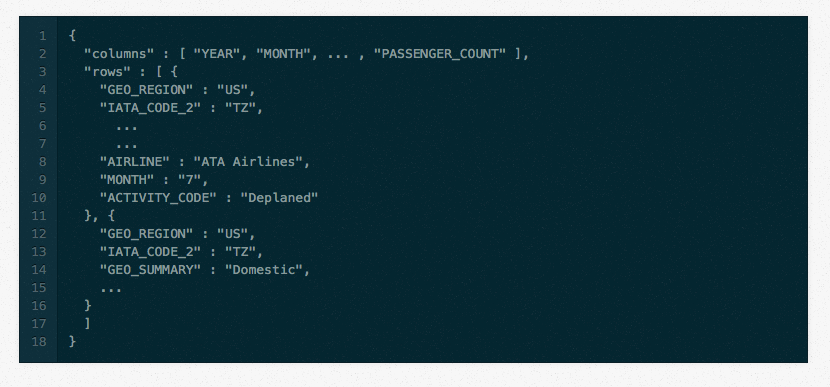
As you can see it is quite simple:
- a first JSON attribute that list the columns
- the list of rows, as JSON documents in an array.
Create a Graph using Node.js & Blessed Contrib
Let’s create a node application.
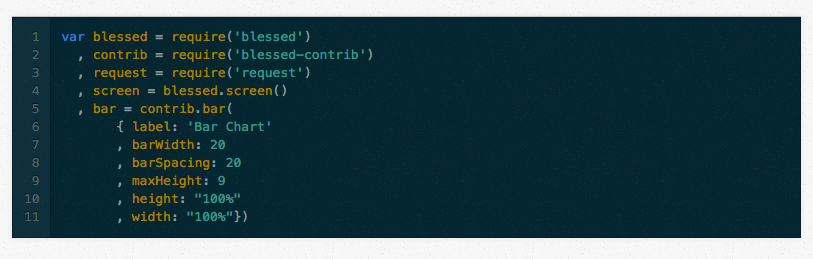
First you have to include:
request: to call the REST APIblessed: to get a rich Terminal APIblessed-contrib: for the dashboard
and then create a screen and a bar chard from Contrib.
So the header of your Javascript file looks like:
So here we have defined a bar char, that will be populated with the columns and rows. For this we need a query, let’s use the number of passengers per year, as follow:

The complete Bar Chat application looks like:
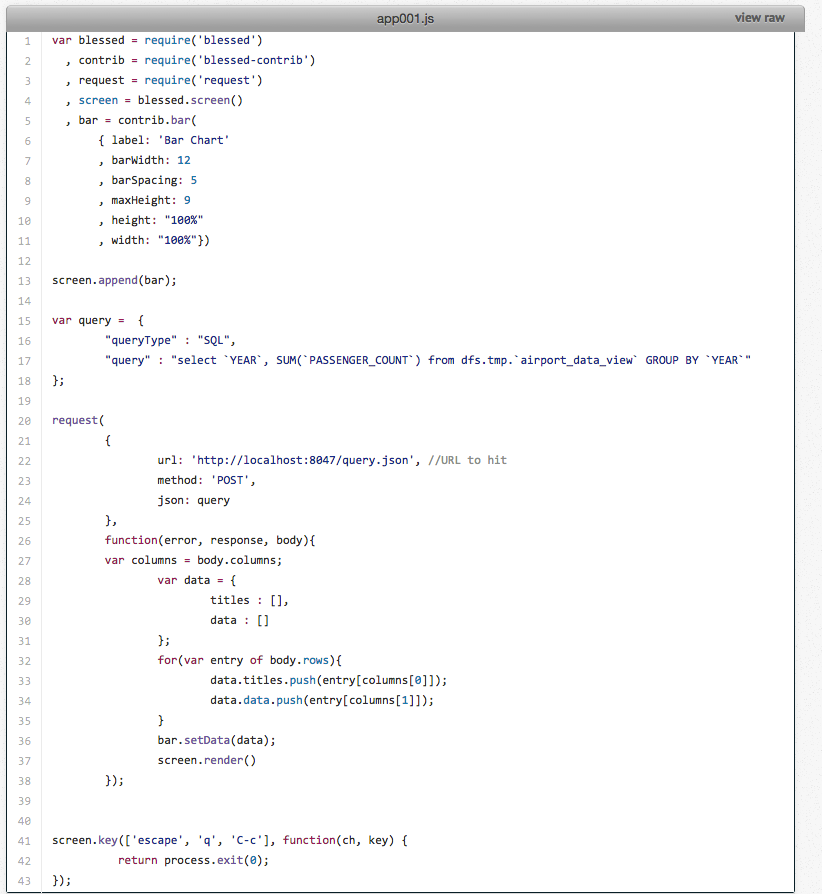
- The lines 15-17 contain the query object used by the Drill REST API
- The lines 26-38 contain the callback from the HTTP call, and the results values are store in the data object (lines 33-34), and then set in the bar chart (line 36)
Run the “Dashboard”
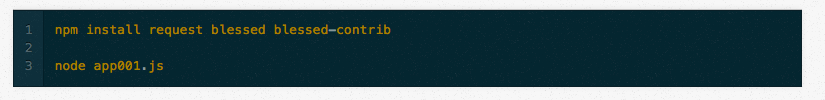
This application shows a simple bar chart, in your terminal. Let’s now create a richer dashboard.
Complete Dashboard
The Bless-Contrib node package allows developer to create rich dashboards that aggregate multiple graphs and could be refresh automatically, as seen in the screencast at the top of this post.
You can find a simple dashboard in this Github repository, once you have cloned it, you just need to run: (be sure that your view is called ‘dfs.tmp.airport_data_view’
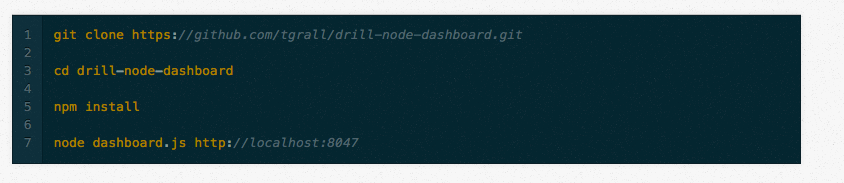
You can even change the CSV file, for example adding new months, and the line chart on the right will be refreshed automatically.
Note: this dashboard sample is very basic and just a quick example explaning how to use Drill REST API in a node.js application
| Reference: | Using Apache Drill REST API to Build ASCII Dashboard With Node from our JCG partner Tugdual Grall at the Mapr blog. |
