I do believe you are familiar with the Peter principle. In general, the principle is an observation that promotions can and will lead to a situation where the promoted person is no longer qualified for the job.

For the JVM the similar problem exists. Promoting objects too fast can have significant impact to performance. In this post we open up the concept of promotion rate, demonstrate how to measure it and explain the practical value of the concept.
It is a follow-up to our post from last week that explained the concept of allocation rate.
Promotion rate is measured in the amount of data propagated from Young generation to Old generation per time unit. It is often measured in MB / sec, similar to allocation rate. Similar to our post about allocation rate, let us again dig deeper to see how promotion rate is calculated and why you should care about the rate at all.
Measuring Promotion Rate
Let us start with the measurement of promotion rate. For this let’s turn on GC logging by specifying -XX:+PrintGCDetails -XX:+PrintGCTimeStamps flags for the JVM. The JVM now starts logging the GC pauses just as seen in the following snippet:
0.291: [GC (Allocation Failure) [PSYoungGen: 33280K->5088K(38400K)] 33280K->24360K(125952K), 0.0365286 secs] [Times: user=0.11 sys=0.02, real=0.04 secs]
0.446: [GC (Allocation Failure) [PSYoungGen: 38368K->5120K(71680K)] 57640K->46240K(159232K), 0.0456796 secs] [Times: user=0.15 sys=0.02, real=0.04 secs]
0.829: [GC (Allocation Failure) [PSYoungGen: 71680K->5120K(71680K)] 112800K->81912K(159232K), 0.0861795 secs] [Times: user=0.23 sys=0.03, real=0.09 secs]
From the above we can extract the size of Young Generation and total heap both before and after the collection event. Knowing the consumption of young gen and total heap, it is easy to calculate the consumption of old gen as just the delta between the two. Expressing the information in GC logs as:
| Event | Time | Young decreased | Total decreased | Promoted | Promotion rate |
|---|---|---|---|---|---|
| 1st GC | 291ms | 28,192K | 8,920K | 19,272K | 66.2 MB/sec |
| 2nd GC | 446ms | 33,248K | 11,400K | 21,848K | 140.95 MB/sec |
| 3rd GC | 829ms | 66,560K | 30,888K | 35,672K | 93.14 MB/sec |
| Total | 829ms | 76,792K | 92.63 MB/sec |
will allow us extract the promotion rate for the measured period. We can see that on average the promotion rate was 92 MB/sec, peaking to 140.95 MB/sec for a while.
Analyzing the impact
Now, being equipped with the definition of promotion rate and knowing how to measure it, let’s look at the practical value of this information.
Again, similar to allocation rate, the main impact of promotion rate is the change of frequency of the GC pauses. But as opposed to allocation rate that affects the frequency of Minor GC events, promotion rate affects the frequency of Major GC events. Let me explain – the more stuff you promote to Old generation the faster you fill it. Filling the Old gen faster means that the frequency of the GC events cleaning Old generation will increase.
From the practical standpoint, facing high promotion rates can surface a symptom of a problem called premature promotion. To explain the problem, let us recall why JVM heap is divided into different memory pools in the first place. The reason for this is based on the observations that:
- Most objects become unused quickly
- The ones that do not usually survive for a (very) long time
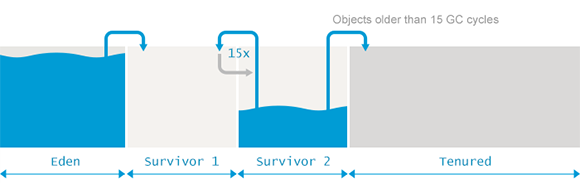
These observations come together in the Weak Generational Hypothesis. Based on this hypothesis, the memory inside the VM is divided into what is called the Young Generation and the Old (or Tenured) Generation. Having such separate and individually cleanable areas allows GC to apply different algorithms to clean these areas, thus improving the performance of the GC.
So premature promotion occurs when objects having short life expectancy are not collected in Young generation and get promoted to Old generation. Cleaning such objects becomes the job for Major GC, which is not designed for frequent runs and results in longer GC pauses significantly affecting the throughput of the application.
A symptom that signals that an application suffers from premature promotion is when promotion rate approaches allocation rate . In our case, we are definitely facing such an issue, as our allocation rate is measured at 161 MB/sec and promotion rate is 92 MB/sec. The solution for the problem might be as simple as increasing the size of young generation via altering -XX:NewSize, -XX:MaxNewSize and -XX:SurvivorRatio parameters.
In many cases, this would still result in too frequent Minor GC runs. In such a situation, you would need to change the application and reduce the allocation rate. How this can be achieved is very much application specific, but introducing caching for objects which are frequently created might be a way to overcome the issue.
Take-away
From the practical standpoint, you should care about allocation and promotion rate to understand how well the GC can keep up with the pace of object creation and promotion to Old Generation. These factors can significantly impact the throughput of your application. The problem can often be alleviated using a more appropriate GC configuration or by a simple change in your source code.
| Reference: | What is promotion rate? from our JCG partner Nikita Salnikov Tarnovski at the Plumbr Blog blog. |
