Visualize all log events and exceptions in production directly from your JVMs – Send as metrics into more than 20 graphing and alerting tools.
We wanted to share two major features we’re introducing that we thought worth sharing – Trends and DevOps Integrations. We began building Takipi because we were tired of using traditional logs to understand what was going inside of our software in production. We wanted to be able to “see into” each error in staging or production when it happened.
We also wanted to have much better detection capabilities to know when things broke down either because of code or environment changes – without continuously scanning and analyzing massive logs files. This new set of features brings us much closer to that vision, which is why we’re pretty excited about it. So let’s get to it :)
Trends
Trends enables you to visualize any combination of log errors, warnings and exceptions in production JVMs without modifying your code, and without sending log files for analysis. The JVM agent detects and tracks all log events and exceptions, regardless of if and how they’re logged to file. Events can be visualized and alerted on using Takipi’s front-end, or through any graphing or alerting tool (e.g Graphite, PagerDuty) that you use. More on that below.
As these metrics are already tracked by the JVM agent today, there’s no additional overhead to this feature (learn more about how Takipi works here). What’s new is that this information is now being reported out of the agent into Takipi’s front-end (or any front-end for that matter, more on that below).
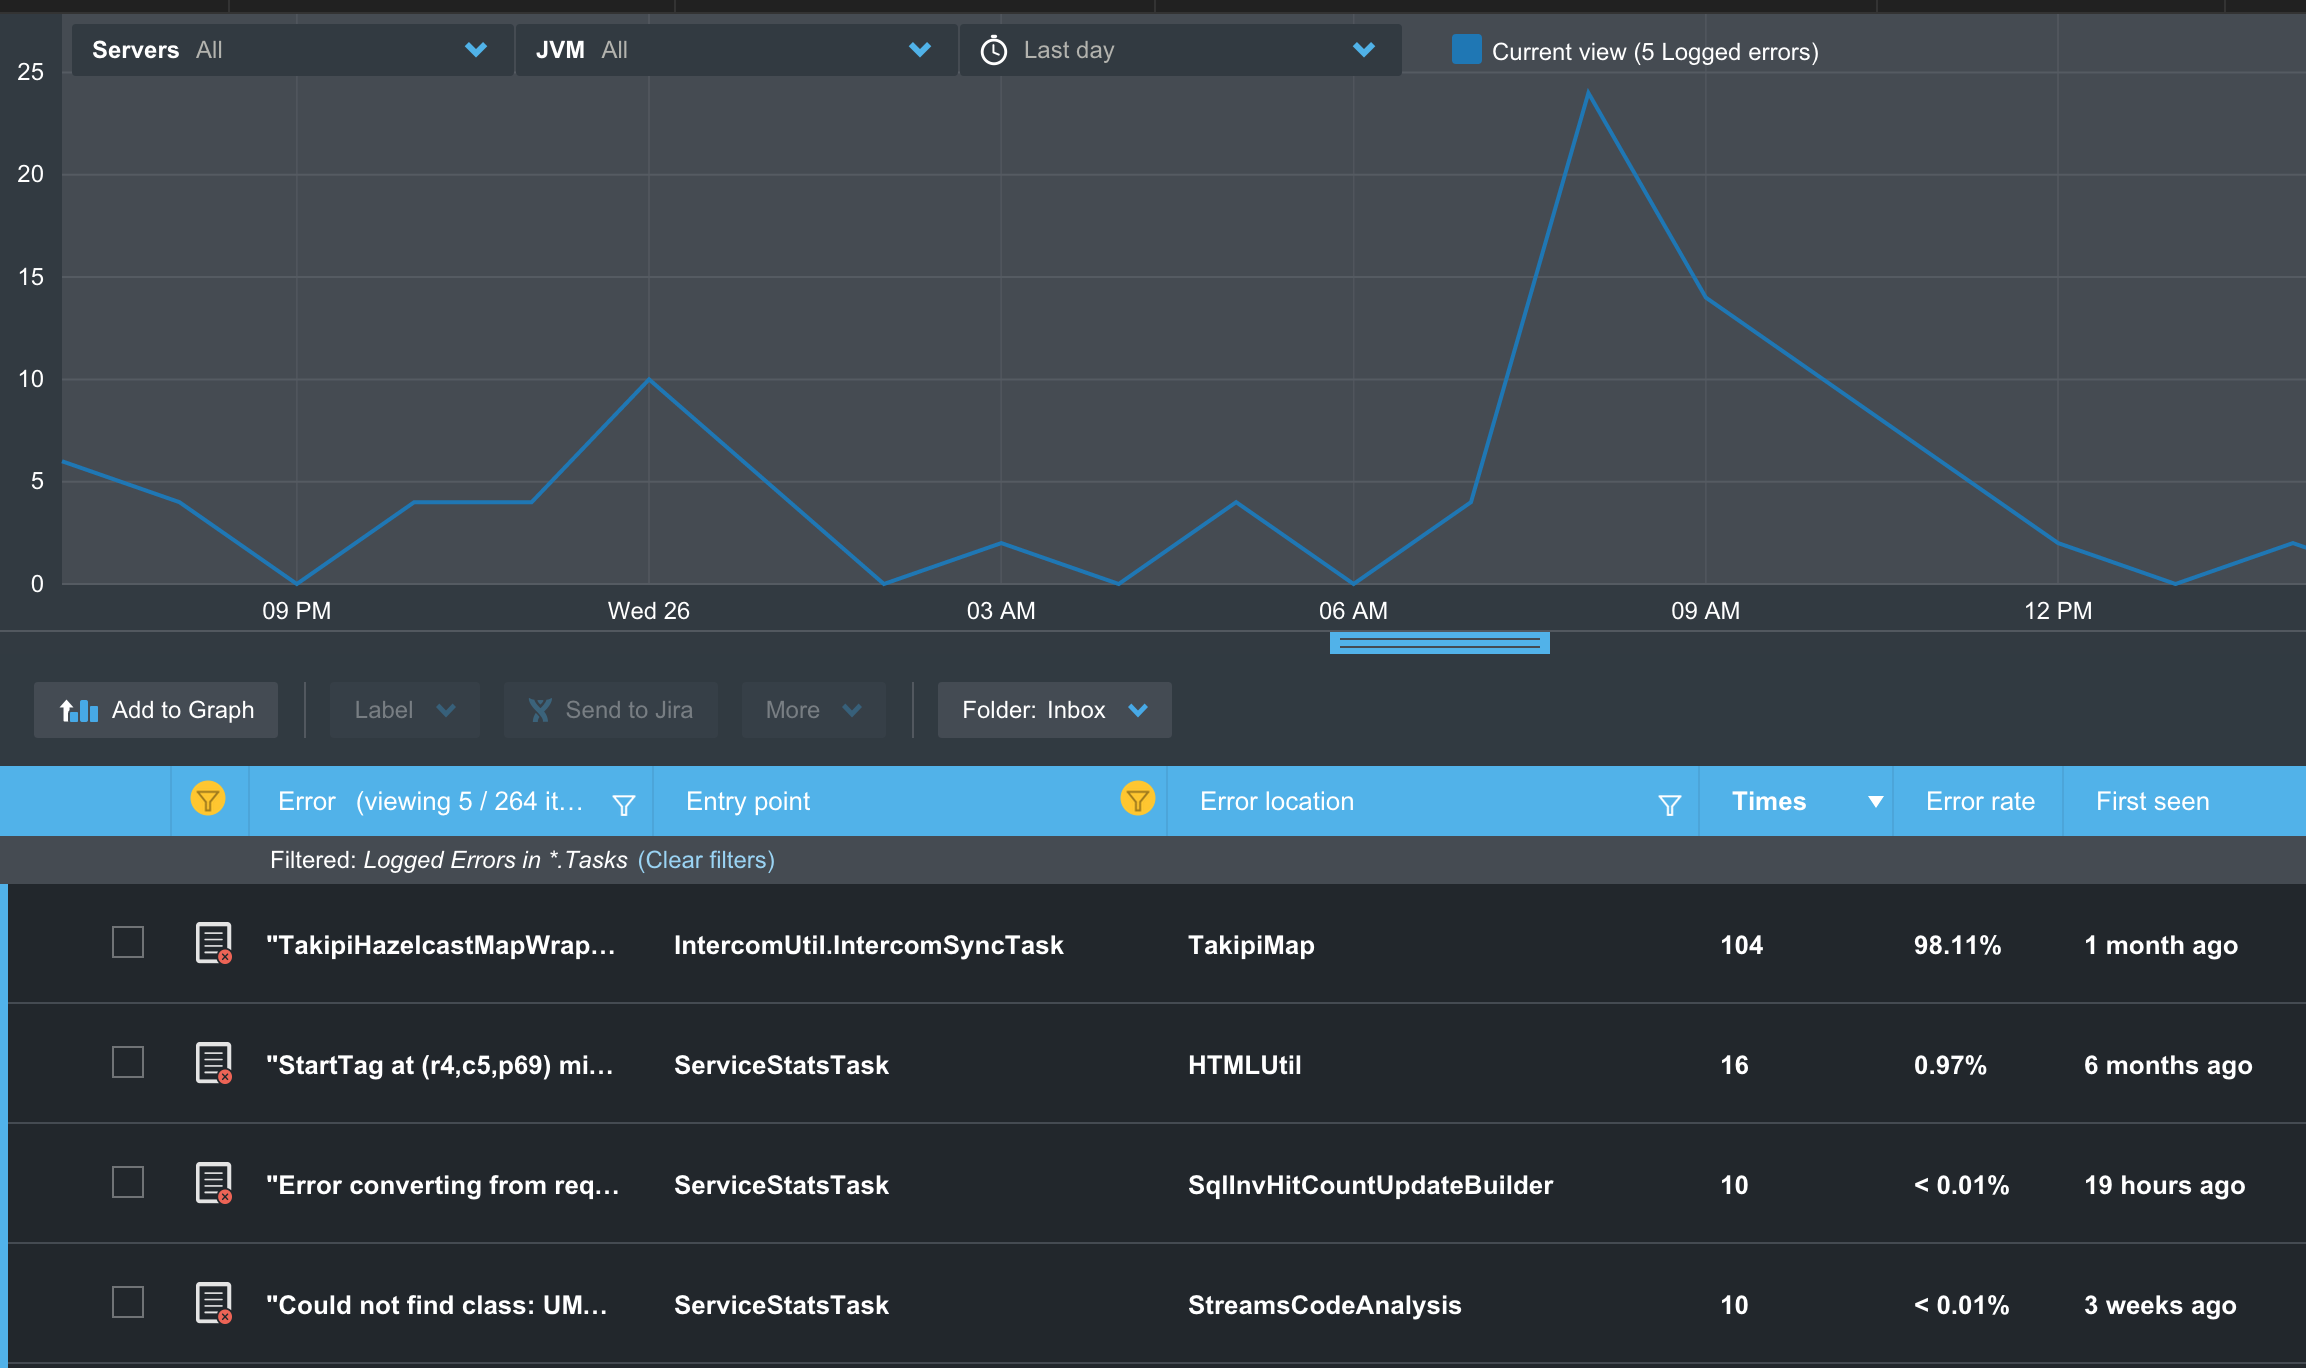
Events are automatically reduced into metrics at the JVM level. You can see exactly how many times an event has happened, and out of how many calls into the code. You can filter events based on their type – caught / uncaught exceptions, logged errors, warnings and more. You can further filter events based on their location in the code, when did they start, or frequency.
Another handy capability lets you correlate related events. This is really useful if you’re looking at a spike in the number of log errors or warnings. You can select the top 5 errors during the spike and add them to the graph and see each one’s contribution. This provides you with a powerful form of operational analysis, without having to adjust your logging or analyze massive logs.
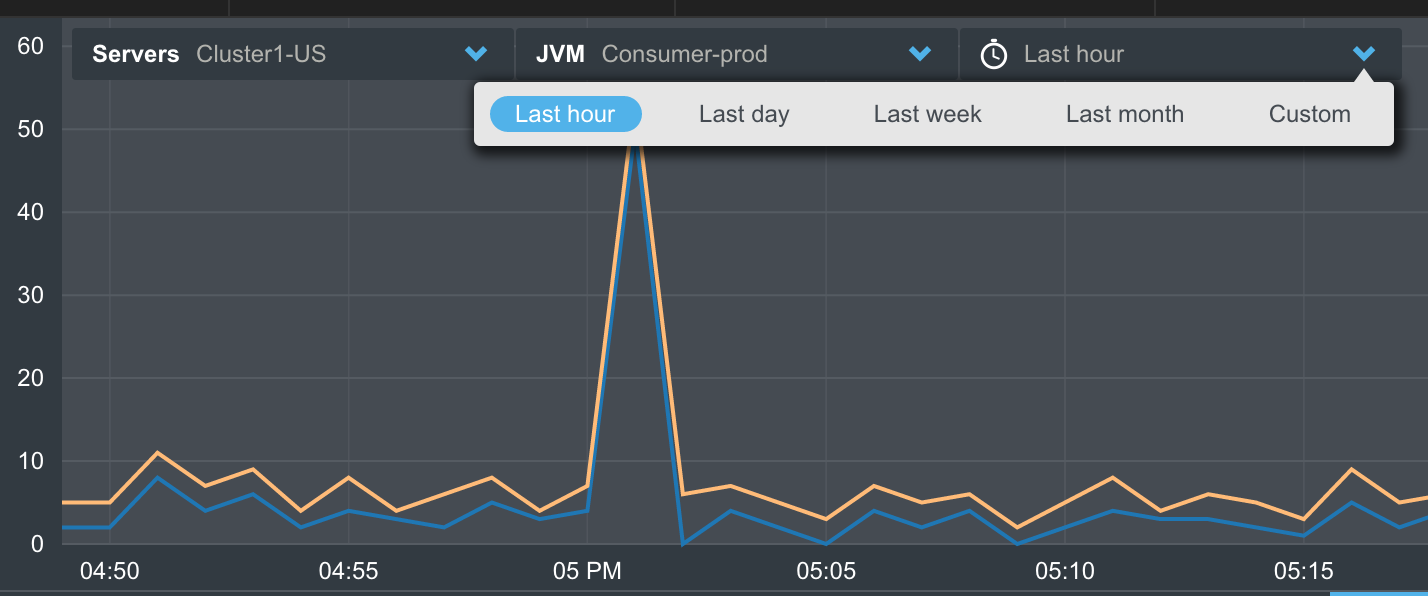
You can narrow down information to focus on events from specific machines or JVMs. You can for example compare the number of errors experienced by JVMs serving different customers in a multi-tenant architecture, or different versions of your application.
Once you’ve focused on a target event you can drill into its root cause in the code. For each event, you can see its most recent error analysis – complete with stack, source and variable state that led to the error.
Integrations
This new capability opens the data captured by the JVM agent to any graphing and alerting tool. This is done via StatsD, an open-source protocol and implementation developed by Etsy which enables applications to transmit metrics in a non-blocking way into any monitoring tool. We chose StatsD because it’s widely used, open-source and uses JavaScript to communicate with almost any monitoring tool on the market.
This enables you to track any series of critical errors in your application such as “All uncaught exceptions”, “DB errors In background tasks”, or “Logged errors in Spark RDDs”, and have the JVM agents transmit these as metrics into Graphite, or receive alerts on them through PagerDuty or Zabbix if they exceed a target threshold.
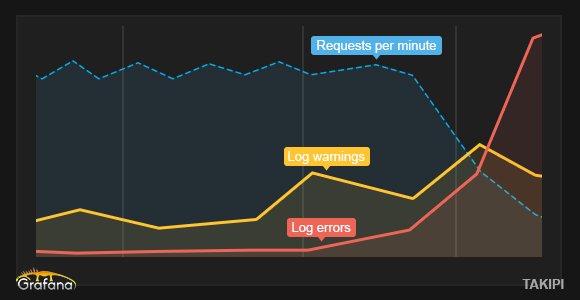
Let’s look at a real-world example:
In this configuration we’re tracking business metrics in Grafana against logged warnings and errors. You can see how the increase on log.warn begins to reduce throughput. Past a certain threshold, the application begins breaking, with a sudden decrease in the number of processed RPMs, and an increase in the number of errors. We can visualize millions of log events from the JVM in real-time overlaid over the critical business metric, without having to continuously parse massive logs. Connecting these metrics into an alerting systems such as Zabbix or Nagios lets us respond in real-time.
Takipi provides close to 20 back-end integrations of of the box, and you can easily add your own. We look forward to see how you’ll use these new features, and hear your questions and feedback in the comments section below.
| Reference: | Takipi 2.0: Trends and DevOps Integrations from our JCG partner Tal Weiss at the Takipi blog. |
