I came across Twitter’s anomaly detection library last year but haven’t yet had a reason to take it for a test run so having got my blog post frequency data into shape I thought it’d be fun to run it through the algorithm.
I wanted to see if it would detect any periods of time when the number of posts differed significantly – I don’t really have an action I’m going to take based on the results, it’s curiosity more than anything else!
First we need to get the library installed. It’s not on CRAN so we need to use devtools to install it from the github repository:
install.packages("devtools")
devtools::install_github("twitter/AnomalyDetection")
library(AnomalyDetection)
The expected data format is two columns – one containing a time stamp and the other a count. e.g. using the ‘raw_data’ data frame that is in scope when you add the library:
> library(dplyr)
> raw_data %>% head()
            timestamp   count
1 1980-09-25 14:01:00 182.478
2 1980-09-25 14:02:00 176.231
3 1980-09-25 14:03:00 183.917
4 1980-09-25 14:04:00 177.798
5 1980-09-25 14:05:00 165.469
6 1980-09-25 14:06:00 181.878
In our case the timestamps will be the start date of a week and the count the number of posts in that week. But first let’s get some practice calling the anomaly function using the canned data:
res = AnomalyDetectionTs(raw_data, max_anoms=0.02, direction='both', plot=TRUE)
res$plot
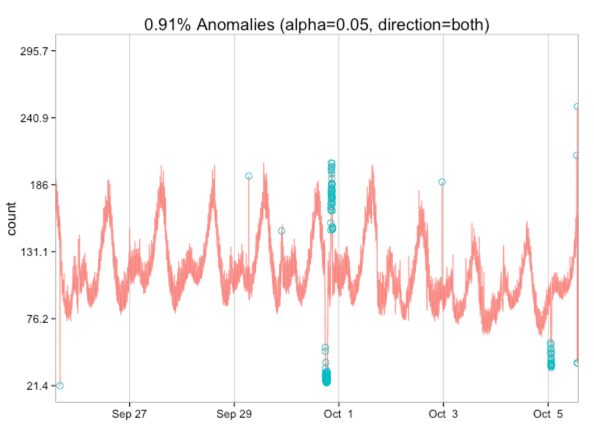
From this visualisation we learn that we should expect both high and low outliers to be identified. Let’s give it a try with the blog post publication data.
We need to get the data into shape so we’ll start by getting a count of the number of blog posts by (week, year) pair:
> df %>% sample_n(5)
                                                           title                date
1425                            Coding: Copy/Paste then refactor 2009-10-31 07:54:31
783  Neo4j 2.0.0-M06 -> 2.0.0-RC1: Working with path expressions 2013-11-23 10:30:41
960                                        R: Removing for loops 2015-04-18 23:53:20
966   R: dplyr - Error in (list: invalid subscript type 'double' 2015-04-27 22:34:43
343                     Parsing XML from the unix terminal/shell 2011-09-03 23:42:11

> byWeek = df %>%
    mutate(year = year(date), week = week(date)) %>%
    group_by(week, year) %>% summarise(n = n()) %>%
    ungroup() %>% arrange(desc(n))

> byWeek %>% sample_n(5)
Source: local data frame [5 x 3]

  week year n
1   44 2009 6
2   37 2011 4
3   39 2012 3
4    7 2013 4
5    6 2010 6
Great. The next step is to translate this data frame into one containing a date representing the start of that week and the number of posts:
> data = byWeek %>%
    mutate(start_of_week = calculate_start_of_week(week, year)) %>%
    filter(start_of_week > ymd("2008-07-01")) %>%
    select(start_of_week, n)

> data %>% sample_n(5)
Source: local data frame [5 x 2]

  start_of_week n
1    2010-09-10 4
2    2013-04-09 4
3    2010-04-30 6
4    2012-03-11 3
5    2014-12-03 3
We’re now ready to plug it into the anomaly detection function:
res = AnomalyDetectionTs(data,
                         max_anoms=0.02,
                         direction='both',
                         plot=TRUE)
res$plot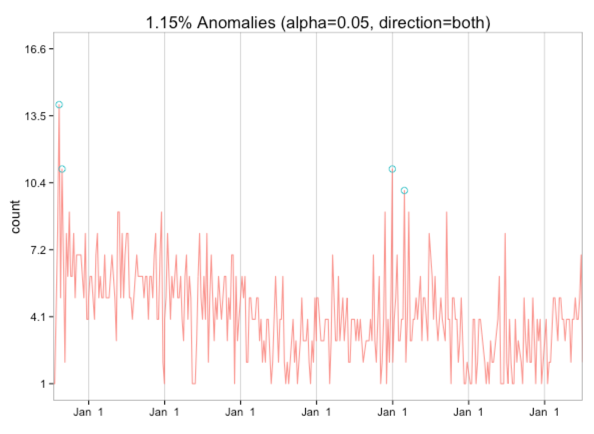
Interestingly I don’t seem to have any low end anomalies – there were a couple of really high frequency weeks when I first started writing and I think one of the other weeks contains a New Year’s Eve when I was particularly bored!
If we group by month instead only the very first month stands out as an outlier:
data = byMonth %>%
  mutate(start_of_month = ymd(paste(year, month, 1, sep="-"))) %>%
  filter(start_of_month > ymd("2008-07-01")) %>%
  select(start_of_month, n)
res = AnomalyDetectionTs(data,
                         max_anoms=0.02,
                         direction='both',
                         #longterm = TRUE,
                         plot=TRUE)
res$plot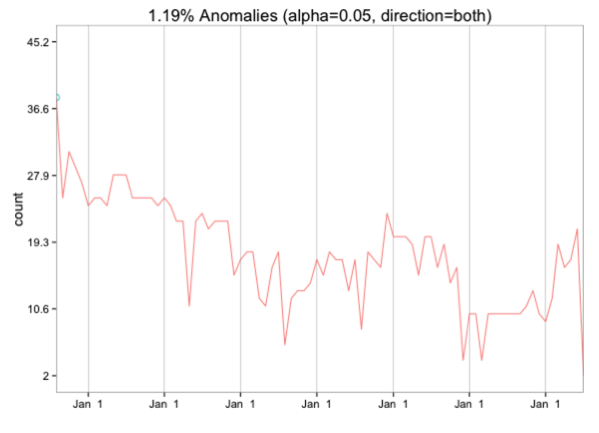
I’m not sure what else to do as far as anomaly detection goes but if you have any ideas please let me know!
| Reference: | R: Blog post frequency anomaly detection from our JCG partner Mark Needham at the Mark Needham Blog blog. |
