What are some of the best alerting tools for tracking errors and uptime?
Having all the automation and management in the world can only take you so far if you have no clue what’s actually happening in your production app. Alerting tools provide insight into the workings and status of your app. Some reach out to you to notify you when something worth your attention pops up, some provide a dashboard for error tracking, and others test your app on a continuous basis.
There are alerting tools for the developer-side with issues like errors and exceptions, and for the operations side with issues like uptime. Visibility is an important consideration for alerting tools. The more a tool requires you to integrate it into your environment, the more you are dependent on the tool’s frameworks, which can also lead to issues down the road.
https://twitter.com/takipid/status/620591808116985857
Exceptions / Errors:
1. Sentry
2. Takipi
3. Airbrake
4. Raygun
Ops / Uptime:
Exceptions / Errors
1. Sentry
 Sentry is an open-source solution that serves as a real time event logging and aggregation platform. It monitors errors and displays when, where, and to whom they happen, promising to do so without relying solely on user feedback. Supported languages and frameworks include Ruby, Python, JS, Java, Django, iOS, .NET and more.
When to use it: A differentiator for Sentry is the fact that it’s open source. If an open source tool with a greater number of SDKs and plugins is something you value, then you should consider Sentry. It’s also one of the most popular error tracking tools in terms of deployment numbers, so if you like going with the most popular tool, that would be another reason to look here.
Price: Three tiers: $24/mo, $79/mo, $199/mo. Tiers are based on data retention and the number of events you want to track per minute.
Pros:
- See the impact of new deployments in real time.
- Provide support to specific users interrupted by an error.
- Detect and thwart fraud as it’s attempted – Sentry provides notifications of unusual amounts of failures on purchases, authentication, and other sensitive areas.
- External Integrations – GitHub, HipChat, Heroku, and many more.
- Through their Java client Raven, Sentry supports the widest range of Java logging frameworks among the alerting tools that rely on them, including Logback, Log4j, and Log4j2.
Cons:
- Requires a binary dependency to operate.
- Documentation is fairly limited.
- If you’re not using one of the supported frameworks, the alternative is a manual setup
- Security can be a concern, as filtering for personally identifiable information can be impossible, requiring manual effort on your part.
2. Takipi
 Takipi tells you when and why your Java/Scala code breaks in production. It detects all types of errors and gives you the code and variable state when they happened. Takipi runs as a Java agent and does not require code changes, binary dependencies, or build configurations.
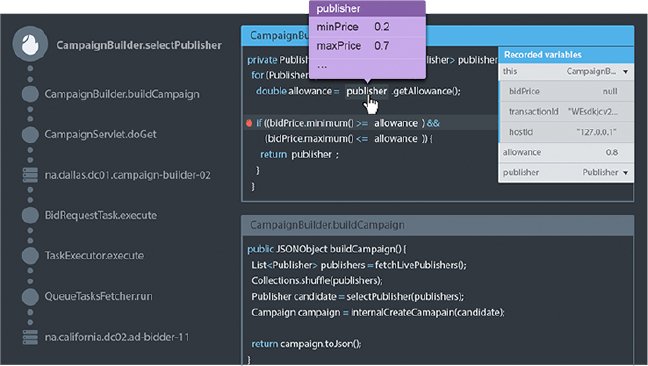
When to use it: If you have a production environment in Java, Scala, or other JVM-based language. If you want to capture the entire picture of your errors and want the actionable information you need to fix them. If you deploy frequently and want to track errors that result from new deployments. If you’re facing complex errors in production that are almost impossible to reproduce.
Price: Free tier, sliding scale pro tier of $69/server/month, and enterprise tier. Tiers are based on data retention, error analyses numbers, and deployment options.
Pros:
- Detects all errors – caught and uncaught exceptions, HTTP errors, and log errors.
- Shows you the code and variable state of errors right when they occurred.
- Works at the JVM level, with no reliance on log files or logging frameworks.
- Production performance – self-throttles to maintain under 3% CPU and IO overhead.
- Automatically detects code deployments and alerts you when they introduce new errors.
- Integrates with JIRA, New Relic, and log management tools.
Cons:
- Non-JVM-based languages are not supported.
- Value is limited for non-production environments, such as staging.
- Does not currently have APIs to integrate with other alerting tools.
https://www.youtube.com/watch?v=U7t-FRvxqJ4
Installation is super quick and lets you see an analysis of your errors within a few minutes, you can check out the workflow and a sample error analysis right here.
3. Airbrake
 Rackspace’s Airbrake has taken on the mission of “No More Searching Log Files.” It provides users with an interface that includes a dashboard with error details and an application specific view. Supported languages include Ruby, PHP, Java, .NET, Python, Swift, JavaScript, and recently, iOS and Android.
When to use it: If you have a mixed environment that includes Ruby, as Airbrake is strong with Ruby. If you like Rackspace as a company. If you want more detail in your stack traces, such as error grouping and trends, from your error tracker. If you want to track errors in mobile apps.
Price: Three tiers: $39/mo, $89/mo, $199/mo. Tiers are based on the number of users and projects you want.
Pros:
- Detailed stack traces, grouping by error type, users and environment variables
- Team productivity – Filter important errors from the noise
- Team collaboration – See who’s causing bugs and who’s fixing them
- External Integrations – HipChat, GitHub, JIRA, Pivotal and over 30 more
- Mobile tracking abilities with iOS and Android support.
Cons:
- More difficult setup relative to other tools in this space
- Less friendly of an interface than other tools
- On the Java front, support is partial at best currently. Airbrake only supports Log4j. There’s no Log4j2 or Logback support. If you don’t use Log4j, you’ll have to set your app up to send data directly to Airbrake.
- Installation for Java requires build changes and only works for Maven as far as build tools go. Going manual is the only other option.
- Security can be a concern, as filtering for personally identifiable information can be impossible, requiring manual effort on your part.
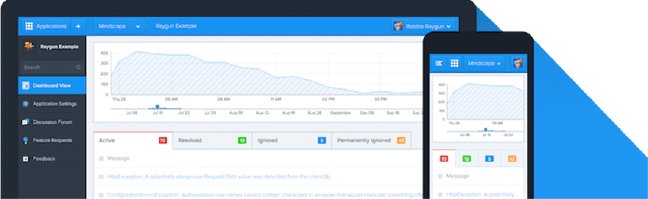
4. Raygun
![]() Mindscape’s Raygun is an error management system that keeps track of exceptions coming from your apps, particularly on the mobile side. It supports various desktop, mobile, and web programming languages, including Java, Scala, .NET, Python, PHP, iOS, Android, and JavaScript. Besides that, sending errors to Raygun is possible through a REST API and a few more Providers (that’s what they call language and framework integrations) that came to life thanks to developer community involvement.
Mindscape’s Raygun is an error management system that keeps track of exceptions coming from your apps, particularly on the mobile side. It supports various desktop, mobile, and web programming languages, including Java, Scala, .NET, Python, PHP, iOS, Android, and JavaScript. Besides that, sending errors to Raygun is possible through a REST API and a few more Providers (that’s what they call language and framework integrations) that came to life thanks to developer community involvement.
When to use it: If you’re looking for full stack traces from your error tracking tool and mobile is part of your environment. For Java users, if you feel the downside of dealing with the manual installation is worth what else you get from Raygun.
Price: Three tiers: $49/mo, $149/mo, $499/mo. Tiers are based on the number of applications and events tracked.
Pros:
- Error grouping – Every occurrence of a bug is presented within one group with access to single instances of it, including its stack trace.
- Full text search – Error groups and all collected data is searchable.
- View app activity – Every action on an error group is displayed for all your team to see: status updates, comments and more.
Affected users – Counts of affected users appear by each error. - External integrations – Github, Bitbucket, Asana, JIRA, HipChat and many more.
- Visualizations and level of detail – provides a deeper level of detail than some other error tracking tools thanks to full stack traces, and delivers good graph visualizations
Cons:
- Incomplete error tracking – On the Java front at least, it only has simple handling for uncaught exceptions, according to its documentation. Caught exceptions, HTTP errors, and log errors can only be tracked individually and manually.
- Manual set up – Everything is manual in terms of setting up Raygun for Java. This puts the onus of implementation (and therefore the quality of error tracking) on the developer.
- Security can be a concern, as filtering for personally identifiable information can be impossible, requiring manual effort on your part.
Sentry vs. Airbrake vs. Raygun
These tools accomplish largely similar things, but they have a few differences. Sentry is open source, while Raygun and Airbrake are not. Raygun is good for mobile environments with an extensive support for mobile languages. Airbrake is good for Ruby. Beyond that, most of the differences come down to installation and supported frameworks. The best approach is to have a clear understanding of your environment and choose the tool that requires the least manual implementation for your specific needs. Comparing the tools across factors that are important to you can provide some clarity as well. Some examples are: data retention, the amount of events captured, performance overhead, languages covered (outside of Java), scalability, and the types of deployments supported (e.g. Hadoop clusters vs web apps).
Ops / Uptime
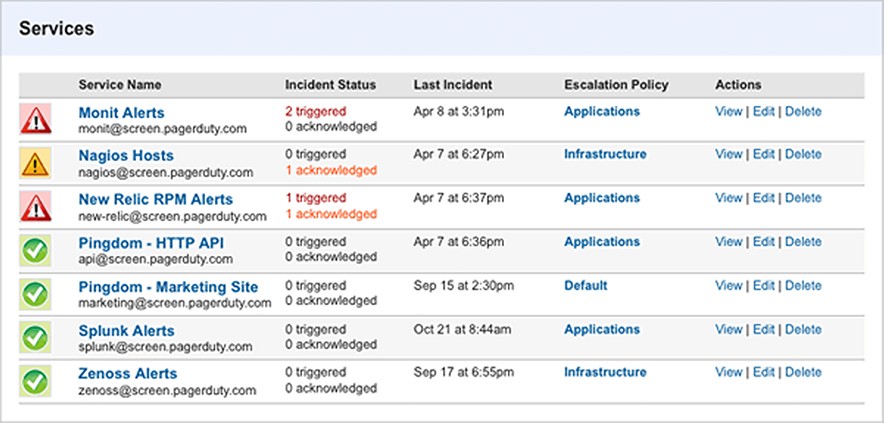
5. Pagerduty
![]() Pagerduty is an alerting tool that pings you when issues arise in the different monitoring tools that you’re having it watch. It doesn’t monitor anything on it’s own, but takes alerts generated by other tools and sends them out to you and your team based on escalation and priority rules you set up. It can send out alerts through email, phones, and several other means of contact. You can use it to collect alerts from your monitoring tools and create schedules to coordinate your team.
Pagerduty is an alerting tool that pings you when issues arise in the different monitoring tools that you’re having it watch. It doesn’t monitor anything on it’s own, but takes alerts generated by other tools and sends them out to you and your team based on escalation and priority rules you set up. It can send out alerts through email, phones, and several other means of contact. You can use it to collect alerts from your monitoring tools and create schedules to coordinate your team.
When to use it: PagerDuty is the main player in this field with only a few competitors (such as VictorOps), so if you’re using several tools and want one unified alerting tool, it’s the one to check out. Also give it a try if an inside-your-environment alerting tool is what you’re looking for in general.
Price: $19-$49 per month per user, depending on feature needs
Pros:
PagerDuty integrates with a huge variety of different tools to gather their alerts and notifications. It provides a fairly extensive and nuanced means of getting alerts out to the right people at the right level of urgency. It has means for escalating alerts as well.
Cons:
It does require some installation and set up. To get the most out of it, you have to spend a bit of time hooking it up with your different tools and entering in the rules for the different alerts you want it to give.
https://www.youtube.com/watch?v=mnSGBf5rpRo
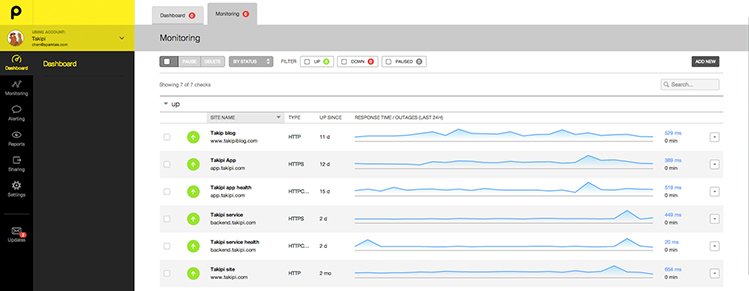
6. Pingdom
![]() Pingdom is a service that provides tracking and alerting on website’s response times, 24/7. It helps answer a crucial question that may seem trivial at first blush: Is your website available? By probing it from different locations all over the globe, it can help differentiate actual downtime from routing and access problems.
Pingdom is a service that provides tracking and alerting on website’s response times, 24/7. It helps answer a crucial question that may seem trivial at first blush: Is your website available? By probing it from different locations all over the globe, it can help differentiate actual downtime from routing and access problems.
When to use it: If you’re looking for an outside your environment alerting tool. If you don’t want to have any setup or installation.
Price: $13-$495 per month, depending on the scale you need
Pros:
Simulates external users and tests your app from the outside. Doesn’t require any installation or changes to your environment whatsoever. The onboarding and setup process is super easy and the price is certainly right.
Cons:
Only usable for external-facing apps and environments. Doesn’t provide a sophisticated level of alerting options.
https://www.youtube.com/watch?v=YN6SwhTQ5eY
Pagerduty vs. Pingdom
These aren’t really true competitors. They are more complementary tools. In fact, Pagerduty has an integration with Pingdom to apply its more nuanced alerting capabilities to the alerts Pingdom generates. PagerDuty is an internal alerting tool, while Pingdom is an external alerting tool.
Conclusion
The modern production environment sets strict requirements for maximum uptime and minimal errors. At the same time, release cycles are becoming shorter and there’s a need to deliver new features faster. To make this a reality and find the right balance between the two, you need to have alerting set up as part of your production environment.
- This post is part of the definitive guide of production tools – Read the full guide
| Reference: | Alerting in Production: 6 Tools to Track Errors and Uptime from our JCG partner Josh Dreyfuss at the Takipi blog. |