What can you learn when your application crashes?
I think, “Hindsight is 20 / 20” is one of the favourite phrases of Toomas Römer, ZeroTurnaround’s VP of Engineering. Well, I’m not actually sure what place in his top of phrases it takes, but I’ve heard him saying it several times. Given that it means that looking at the past you can reason about things much better than predict them happening in the future, it usually happens when we have failed to predict something correctly and reflected on the results of the actions. If you hear this phrase often enough it means that you often enough reflect on things and you know that every failure, every mistake offers a lesson to learn.
Well, it might be the case that you don’t make mistakes, or you don’t make any important mistakes that propagate to your final product, to the end-users. I do make them occasionally, more than once I fork-bombed our servers and countless times committed broken code. Sometimes it slipped into final products as well. Every time the broken code I wrote came back to bite me, I learned something. Every time I had to investigate what was the reason for the errors at hand, reproduce it on my machine, and produce a fix.
In this post I want to look at the tools and techniques that can help you obtain relevant information about errors and help you reproduce and fix them.
New Post: When JVMs Crash: How to Investigate the Root Cause of Your Toughest Errors http://t.co/bvHVYhT2m4 pic.twitter.com/dKhgiKMhT5
— OverOps (@overopshq) April 27, 2015
Structured Logging
The default goto way of figuring out what’s going on in some code is to read the source. When that source is actually what you work on everyday for 8-10 hours and you still cannot find the culprit, then you have to add some situational awareness of the context at the time of the error. Naturally, you get that context from the logs. I don’t doubt that you’re using logs all the time, but here’s a nice trick you can do to make logging more useful.
Thread names
You can get more information about the context, if you configure thread names to reflect what’s happening in the application. Thread names are almost always included in the logs and printing a thread name does not impose any significant performance overhead. For example finding out the caller class of the logger takes time, as you have to construct and traverse the stack trace. But accessing Thread names is fast and cheap. Additionally, thread names are rarely used for anything else, so stuff as much information there as you think is wise: system component name, transaction ID, username who issues the request etc. You’ll thank these verbose logs later when debugging an issue will be a breeze.
More log types
Another trick is to make the JVM produce more logs, you can make it produce garbage collection logs that you can analyse later, JIT compilation logs and heap dumps. Most of these probably not suited for production systems, because of the performance overhead, but you can definitely experiment with them in staging or on your own development station.
Later you can tune the performance of Garbage collection and optimise it quite heavily, like this post describes, but for a start you can enable garbage collection logs with the following JVM options: -XX:+PrintGC -XX:+PrintGCDetails -XX:+PrintGCTimeStamps and -XX:+PrintGCDateStamps -Xloggc:file.
Manual investigation of JIT compilation logs won’t probably tell you much, but you can always experiment with the JITWatch to see what’s happening when JVM compiles your code.
One option that might be a good idea to turn on for the production systems is: -XX:+HeapDumpOnOutOfMemoryError, which will make the JVM to create a memory dump when the the OutOfMemory error occurs.
There are different kinds of logs and not all are equally useful for crash management, but they all are essential and the easiest to use tool in your arsenal.
Modern Developer Tools
Wait, what? Are you trying to tell me that in the 21st century there’s no better way to figure out what’s happening in your application than to go log-digging and employ the forensics techniques from early stone-age? Well, not really. But I don’t know any general purpose tool that can give you the best insight into what and why it’s happening in your code.
In the development environment, the situation is easier, you have loads of spare computing resource and you can risk attaching all kinds of tools that do not necessary went through the Ops approval process.
Consider for example this post by Plumbr’s Ivo Mägi, where he discusses if their memory leak detection tool is for operations people or developers. Ideally, the tool is useful and stable, so you can both enjoy its performance and functionality during the development, and not be afraid to attach it to live systems. However this rarely happens, you don’t debug in production, you don’t want to swap classes on the fly with JRebel, etc.
However, that doesn’t mean that you shouldn’t employ any modern tools at all and limit yourself to maybe old-fashioned, but proven ways of uncovering roots of the evil: logs. No doubt that logs will still be the most useful source of forensic info you’ll have, but you can do better.
In general, the development process consists of staring at the code a lot, thinking and sometimes changing the functionality bits here and there. It’s a hard work and it requires concentrating on the problem and on the system logic a lot. If you know a methodology or some magical recipe that makes things easier, please share the wisdom with me on Twitter: @shelajev. Until then, we’ll run with the premise that software engineering requires concentration. It means that there are 2 main non-functional requirement to any tool: being powerful in what it can do and being non-intrusive, so you don’t have to break your brains over how to achieve what you need.
The most efficient way to reproduce some condition is to have a test for it. When it’s not available, the next best thing is to use a recording debugger, like Takipi for production debugging or Chronon for example.
Chronon enables you to produce recordings of the operations that occur in your code, what results they produce, what’s on the stack at every given moment and produce a transaction log of the program execution. Later you can feed this log to another program run and step through the execution back and forth.
If you’re trying to pinpoint performance issues, Java Flight Recorder from Java Mission Control allows collecting information the data about program’s execution profile, garbage collection stats, heap usage data like object allocation, locks and IO details, etc. If you want to run Java Mission Control attached to a production node, you have to pay for a license, but for development environment, there’s no problems like that.
Then again, if you want to monitor your production environment you might want to go for an error management solution that was created specifically for the purpose of getting you as much information about errors as there is.
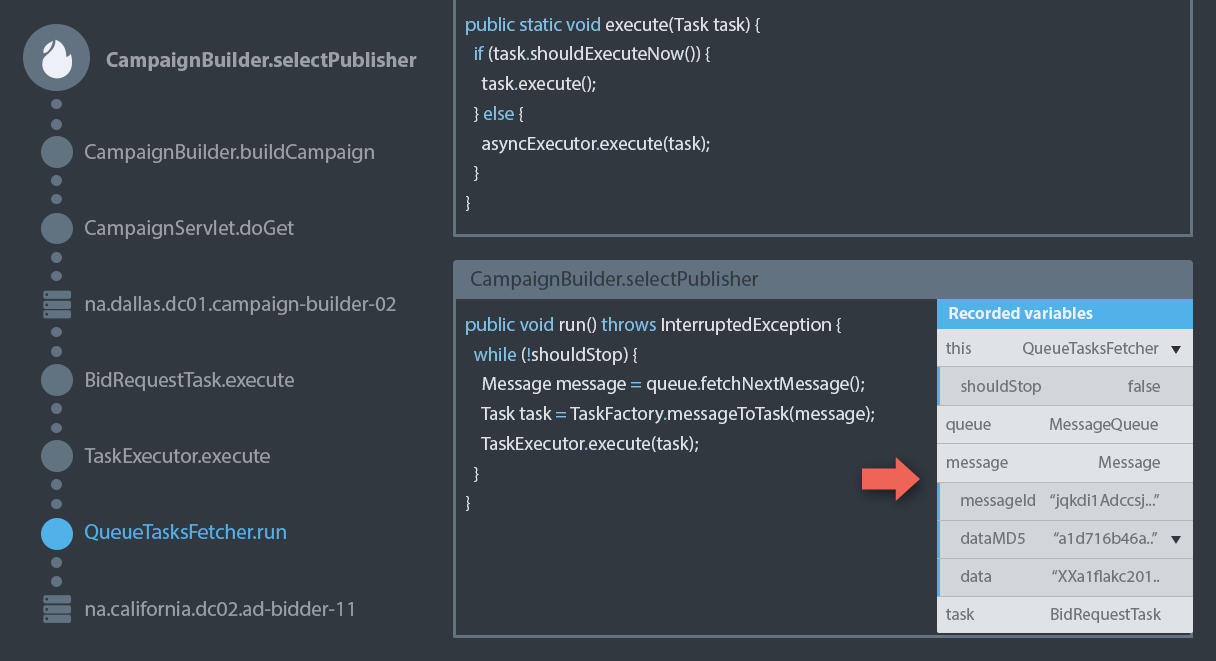
Takipi’s dashboard and native agents allow you to debug your code in production without using log files. You’ll get error analysis, unified stack traces in a distributed system and other things that can greatly reduce the time to understand and fix the errors you have.
Conclusion
In this post we looked at several tools and techniques that can make you more aware of what is happening in your application both while you’re actively developing it or when it gets deployed to the production environment. Be it through a masterful use of JMC with a flight recorder or via elegantly crafted logs, reproducing errors are the most important step in fixing any mistake.
What you want to remember is that despite the fact that good old tools work every time, there are new developments in almost every area and crash management and error monitoring is no exception. Learn what tools are there and learn how to use them properly. It will make you a better developer.
| Reference: | When JVMs Crash: How to Investigate the Root Cause of Your Toughest Errors from our JCG partner Oleg Selajev at the Takipi blog. |
