How do you compare the structure of two different programs? You could fire up your IDE and dive in. A week’s snorkeling will no doubt produce a valid conclusion. If, however, you have only ten seconds to decide then you need some other tool.
Engineers facing similar problems in other fields regularly look to the cumulative distribution function (CDF) for results and software engineers could learn much from them.
Firstly, though, the usual (for this blog) preamble: well-structured programs facilitate update predictability. One reason why updates deviate horribly from prediction is ripple effect, whereby changing code in one place causes changes in another, which lead to further changes, etc. Two factors greatly influence ripple effect: transitive dependency number and length. Hence programs with more and longer transitive dependencies than others tend, all else being equal, to be less well-structured.
So our task becomes: how do we compare the number and length of transitive dependencies in two different programs? (We shall investigate here dependencies between methods, as opposed to classes or packages.)
Merely counting transitive dependencies yields a poor comparative tool: larger programs tend to have more transitive dependencies. Instead, we should compare the transitive dependency density: the number of transitive dependencies divided by the number of methods, thus normalizing the quantity. Program A’s having a higher density than program B suggests program A’s structural inferiority.
To compare transitive dependency lengths, however, we can use the CDF (actually a variant thereof) of the transitive dependency length. For example, figure 1 presents the CDF of JUnit‘s transitive dependency lengths.
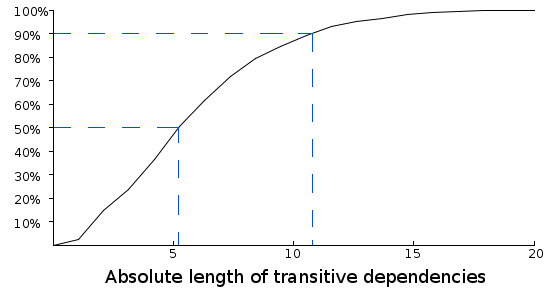
The X-axis of figure 1 shows the lengths of JUnit’s transitive dependencies: all its transitive dependencies are between 1 and 20 methods long. The Y-axis shows the percentage of JUnit’s transitive dependencies that are equal to or less than a particular length.
The graph reveals that 50% of JUnit’s transitive dependencies are around 5 methods long or less. 90% are around 11 methods long or less. And as JUnit’s longest transitive dependency is 20 methods long, 100% of its transitive dependencies must be less than or equal to 20 methods long.
But this does not yet allow a straight comparison as the absolute values of the X-axis would mean that two programs might occupy different ranges, skewing the graph. Instead of absolute transitive dependency length, however, we can plot on the X-axis the percentage of the maximum length than any specific transitive dependency has, see figure 2.
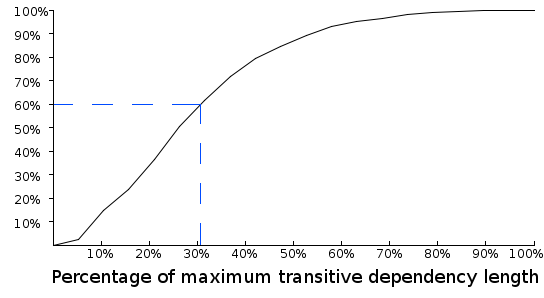
It may look odd to have percentages on both axes, but figure 2 shows that 60% of JUnit’s transitive dependencies are approximately 30% (or less) as long as the longest transitive dependency. And 90% of JUnit’s transitive dependencies are around 55% (or less) as long as the longest transitive dependency.
Well-structured systems waft this curve to the left: with more short transitive dependencies than poorly-structured systems, they boast higher percentages of their transitive dependencies being lower percentages of the maximum length.
Finally, we can now plot multiple systems side-by-side, see figure 3.
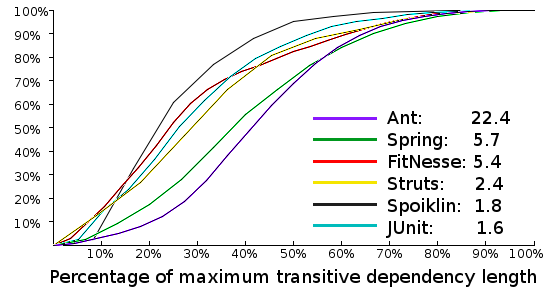
The numbers in the legend of figure 3 show each system’s transitive dependency densities.
Well-structured systems veer upwards quickly, so comparing the six systems in the 30% – 50% percentage length is revealing. An unsettling gap yawns between extremities: only 25% of Ant‘s transitive dependencies are less than 30% of maximum, whereas 70% of Spoiklin’s transitive dependencies are less than 30% of maximum. Coupled with Ant’s eye-watering 22 transitive dependencies per method, this strongly suggests Ant’s less-than-ideal structure.
Spring offers a beautiful structure on package-level but, as has been mentioned before, on method-level it suffers greatly from long transitive dependencies, with 30% of its transitive dependencies stretching longer than half of the maximum length.
JUnit, FitNesse and Struts all trace similar trajectories, with 80% of their transitive dependencies being less than half of the maximum length. So similar are their curves that their densities alone may decide their structural fates, with JUnit and Struts both showing good, ripple-effect-bustingly low densities.
Summary
A CDF offers an overview of an entire system, at a glance and from a particular perspective, making it highly suitable for the analysis of large complex software systems. Of course, CDF graphs alone do not categorically evaluate structural magnificence or decrepitude; extreme outliers can compromise results; some snorkeling remains advised. CDFs can, however, offer invaluable and speedy insight.
| Reference: | Software engineering as … engineering. from our JCG partner Edmund Kirwan at the A blog about software. blog. |

Why are you dividing by the maximum? While maximum is nice for making percentages it is not great because it *might* be very sensitive to small changes. If a programmer were tasked with optimizing for your CD charts the first thing they would go after is reducing that one long chain, or perhaps if a progammer made a small change that increased the maximum then all of the metrics would move…”unfairly”. I guess it depends on the distribution, but it does seem unnecessarily dependent on a single value. Why display as a cumulative sum instead of a histogram? I have… Read more »