This blog post discusses benchmarking web service performance under load. To learn more about the theory of web service performance, read Little’s Law, Scalability and Fault Tolerance.
Benchmarking a Web Service with Blocking and Asynchronous IO
How a web application (or a web service) behaves under load, in the face of various failures, and under a combination of the two, is the most important property of our code – after its correctness, of course. Because web services usually do very common operations – interrogate caches, databases or other web services to collect data, assemble it and return it to the caller – that behavior is mostly determined by the choice of web framework/server and its architecture. In a previous blog post, we discussed Little’s Law, and applied it to analyze the theoretical limits of different architectural approaches taken by web servers. This post – which complements that one – revisits the same topic, only this time we will measure performance in practice.
Web frameworks (and I use the term to refer to any software environment that responds to HTTP requests by running user code, whether it’s called a framework, an application server, a web container, or simply part of the language’s standard libraries) choose one of two architectures. The first is assigning a single OS thread that will run all of our code until the request completes. This is the approach taken by standard Java servlets, Ruby, PHP and other environments. Some of those servers run all user code in a single thread, so they can handle only one request at a time; others run concurrent requests on different, concurrent, threads. This approach – called thread-per-request – requires very simple code.
The other approach is to use asynchronous IO and schedule request-handling code for many concurrent requests – as cleverly as possible – onto one or more OS threads (presumably using fewer OS threads than the number of concurrent requests). This is the approach taken by Node.js, Java asynchronous servlets, and JVM frameworks like Vert.x and Play. The strength of this approach is, supposedly (that’s exactly what we’ll measure), better scalability and robustness (in the face of usage spikes, failures etc.), but writing code for such asynchronous servers is more complicated than for the thread-per-request ones. How much more complicated the code is depends on the use of various “callback-hell-mitigation” techniques such as promises, and/or other functional programming approaches, usually involving monads.
Other environments seek to combine the best of both approaches. Under the covers they use asynchronous IO, but instead of having programmers use callbacks or monads, they supply the programmer with fibers (aka lightweight threads or user-level threads), which consume very little RAM and have negligible blocking overhead. This way, these environments attain the same scalability/performance/robustness advantages of the asynchronous approach while preserving the simplicity and familiarity of synchronous (blocking) code. Such environments include Erlang, Go, and Quasar (which adds fibers to the JVM).
The Benchmark
- The full benchmark project can be found here.
To test the relative performance of the two approaches, we will use a simple web service, written in Java using the JAX-RS API. The test code will simulate a common modern architecture of microservices, but by no means are the results limited to the use of microservices. In a microservice architecture, the client (web browser, mobile phone, set-top box) sends a request to a single HTTP endpoint. That request is then broken down by the server to into several (often many) other sub-requests, which are sent to various internal HTTP services, each responsible for providing one type of data, or for carrying out one kind of operation (for example, one microservice can be responsible for returning the user profile, and another – their circle of friends).
We will benchmark a single main service that issues calls to one or two other microservices, and examine the main service’s behavior when the microservices operate normally and when they fail.
The microservices will be simulated by this simple service, installed at http://ourserver:8080/internal/foo:
@Singleton
@Path("/foo")
public class SimulatedMicroservice {
    @GET
    @Produces("text/plain")
    public String get(@QueryParam("sleep") Integer sleep) throws IOException, SuspendExecution, InterruptedException {
        if (sleep == null || sleep == 0)
            sleep = 10;
        Strand.sleep(sleep); // <-- Why we use Strand.sleep rather than Thread.sleep will be made clear later
        return "slept for " + sleep + ": " + new Date().getTime();
    }
}
All it does is take a sleep query parameter that specifies the amount of time (in milliseconds) the service should sleep before completing (with a minimum of 10 ms). This can simulate a remote microservice that might either take a long – or short – time to complete.
To simulate load we used Photon, a very simple load generation tool that uses Quasar fibers to issue a very large number of concurrent requests and measure their latencies, in a manner that’s relatively less prone to coordinated omission: Every request is sent by a newly spawned fiber, and the fibers, in turn, are spawned at a constant rate.
We tested the service on three different embedded Java web servers: Jetty, Tomcat (embedded) and Undertow (the web server powering the JBoss Wildfly application server). Now, because all three servers conform to Java standards, we reuse the same service code for all three. Unfortunately, there is no standard API for programmatically configuring a web server, so most of the code in the benchmark project simply abstracts away the three servers’ different configuration APIs (in the JettyServer, TomcatServer, and UndertowServer classes). The Main class simply parses the command line arguments, configures the embedded server, and sets up Jersey as the JAX-RS container.
We’ve run the load generator and the server each on a c3.8xlarge EC2 instance, running Ubunto Server 14.04 64 bit and JDK 8. If you’d like to play with the benchmarks yourself, follow the instructions here.
The results presented here are those obtained when running our tests on Jetty. Tomcat responded similarly to the plain blocking code, but much worse than Jetty when fibers were used (this requires further investigation). Undertow behaved the opposite way: when using fibers it performed similarly to Jetty, but crashed quickly when the thread-blocking code was facing high load.
Configuring the OS
Because we will be testing our service under heavy load, some configuration is required to support it at the OS level.
Our /etc/sysctl.conf will contain
net.ipv4.tcp_tw_recycle = 1
net.ipv4.tcp_tw_reuse = 1
net.ipv4.tcp_fin_timeout = 1
net.ipv4.tcp_timestamps = 1
net.ipv4.tcp_syncookies = 0
net.ipv4.ip_local_port_range = 1024 65535
and will be loaded thus:
sudo sysctl -p /etc/sysctl.conf
The /etc/security/limits.conf will contain
*		hard nofile	200000
*		soft nofile	200000
Configuring Garbage Collection
Most Java garbage collectors operate under the generational hypothesis which assumes most object will have a very short lifespan. However, when we start testing the system with a (simulated) failed microservice, it will generate open connections that last for many seconds, and only then die. This type of “medium lifespan” (i.e. not short, but not too long either), is the worst kind of garbage. After seeing that the default GC resulted in unacceptable pauses, and not wanting to waste too much time fine tuning the GC, we’ve opted to give HotSpot’s new(ish) G1 garbage collector a try. All we had to do was pick a maximum pause time goal (we chose 200ms). G1 behaved spectacularly (1), so we haven’t spent any more time on tuning the collector.
- Probably because objects were allocated in groups that all died at the same age. This pattern probably plays exactly into G1’s strengths.
Benchmarking the Synchronous Approach
This is the code of our service-under-test, mounted at /api/service, beginning with the synchronous approach. (the full class, which also includes the configuration of the HTTP client, can be found here):
@Singleton
@Path("/service")
public class Service extends HttpServlet {
    private final CloseableHttpClient httpClient;
    private static final BasicResponseHandler basicResponseHandler = new BasicResponseHandler();

    public Service() {
        httpClient = HttpClientBuilder.create()
            ... // configure
            .build();
    }


    @GET
    @Produces("text/plain")
    public String get(@QueryParam("sleep") int sleep) throws IOException {
        // simulate a call to a service that always completes in 10 ms - service A
        String res1 = httpClient.execute(new HttpGet(Main.SERVICE_URL + 10), basicResponseHandler);

        // simulate a call to a service that might fail and cause a delay - service B
        String res2 = sleep > 0 ? httpClient.execute(new HttpGet(Main.SERVICE_URL + sleep), basicResponseHandler) : "skipped";

        return "call response res1: " + res1 + " res2: " + res2;
    }
}
Our service, then, calls one or two other microservices, which we can name A and B (both simulated, of course, by our SimulatedMicroservice). While service A always takes 10 ms to complete, service B can be simulated to display varying latencies.
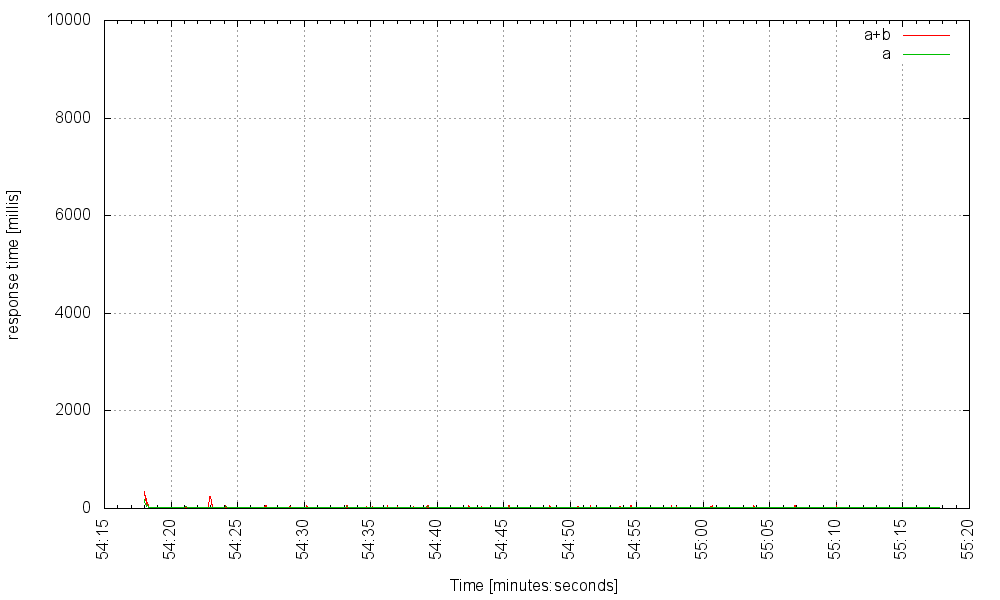
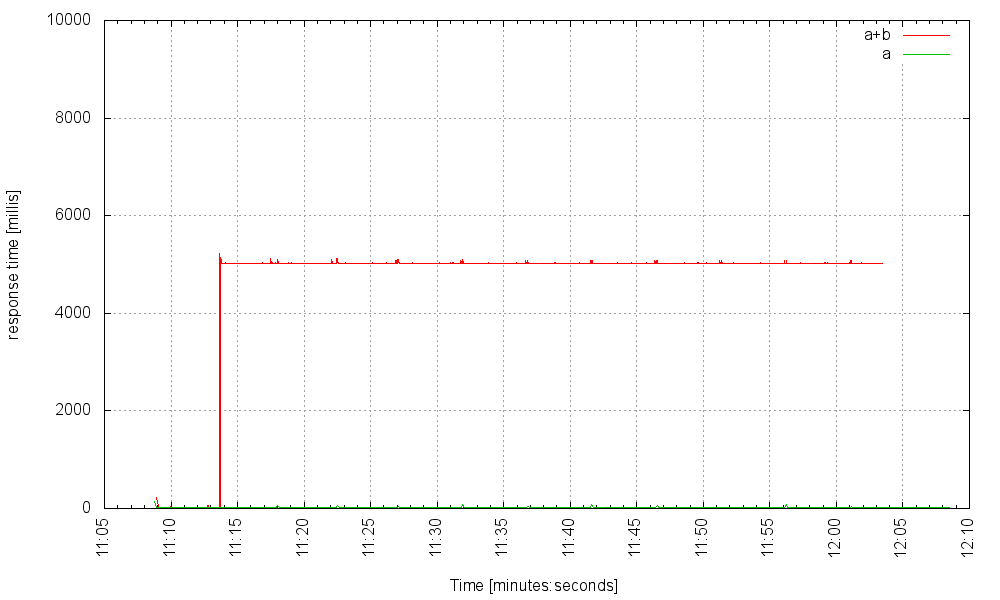
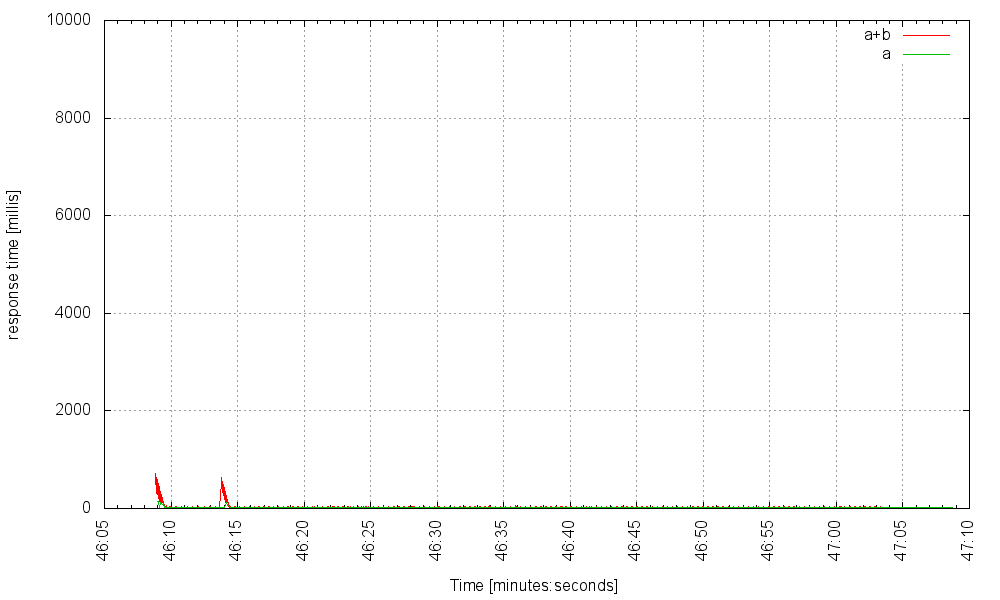
Let’s suppose service B is operating normally, and returns its result after 10 ms of work. Here is how our service responds to 1000 requests per second, over time (the server is using a pool of 2000 threads). The red line is the latency for requests requiring both microservices, and the green line is the latency for those requests that only trigger calls to microservice A:
We can even take up the rate to 3000Hz:
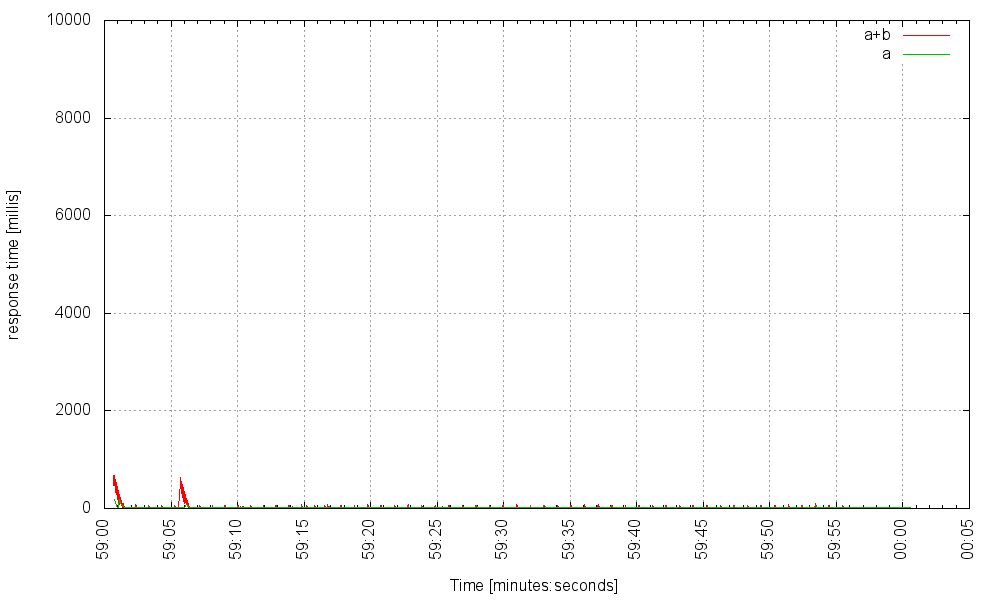
Beyond 3000Hz the server experiences severe difficulties.
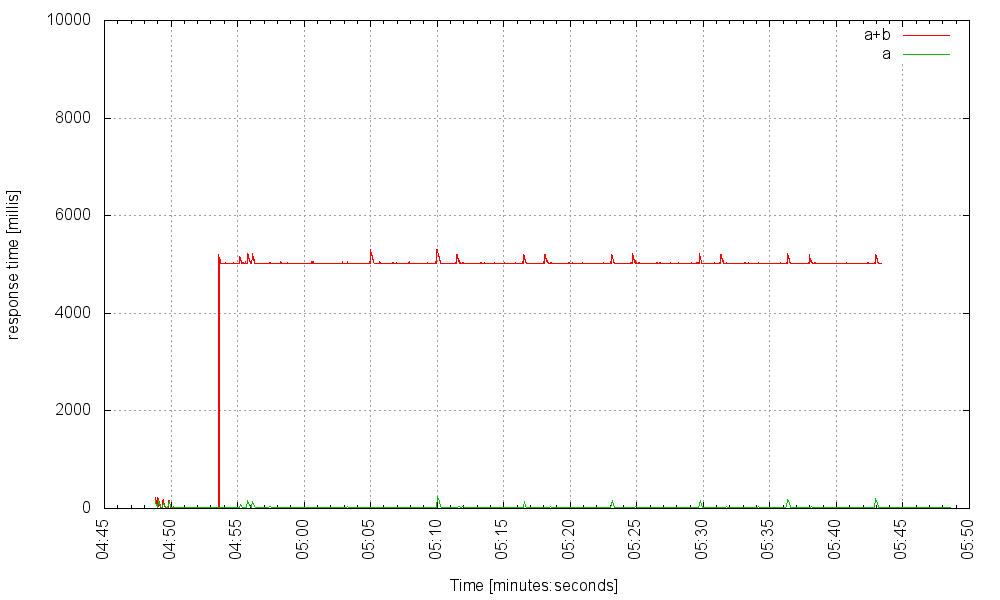
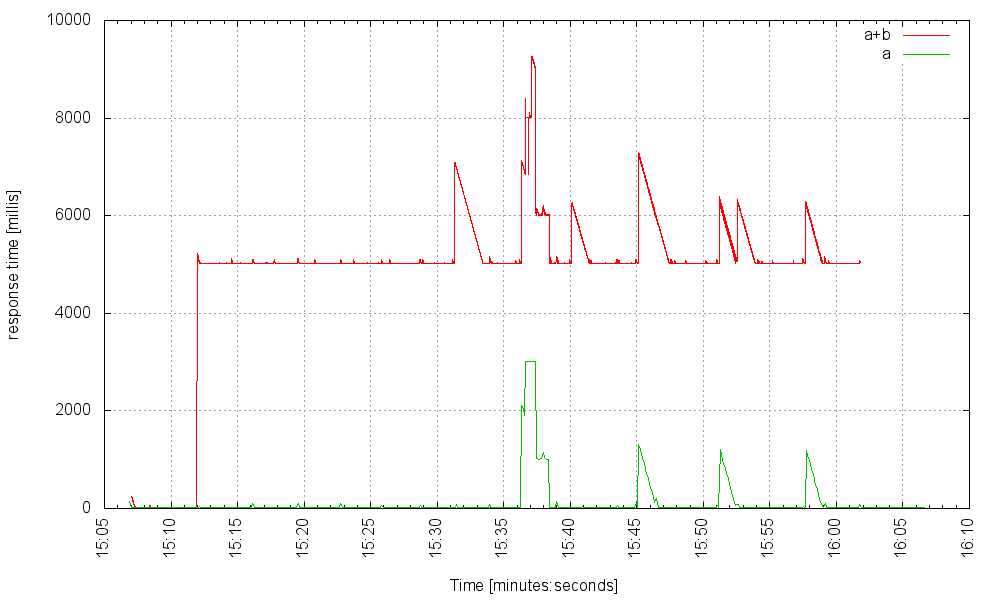
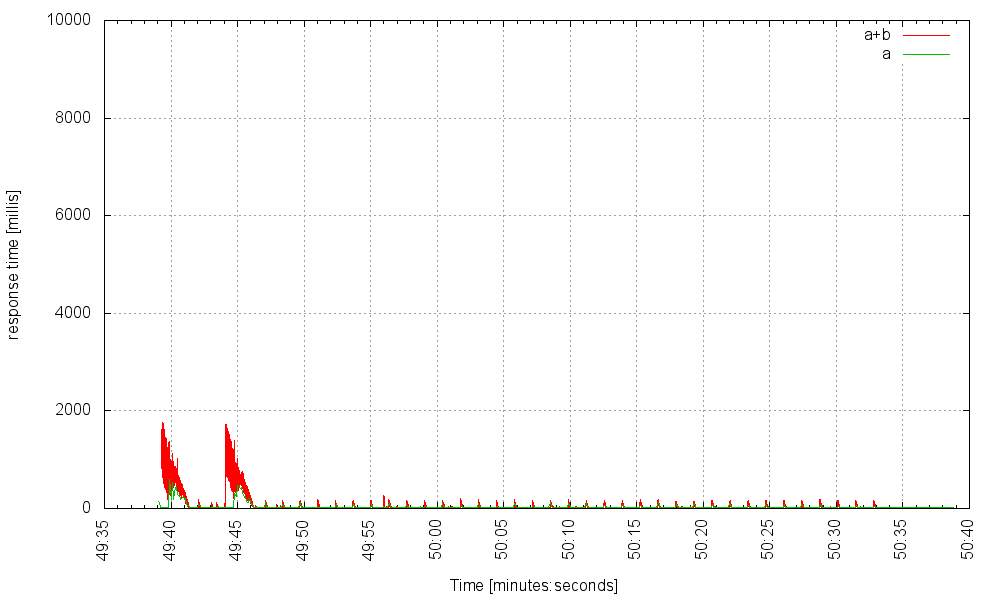
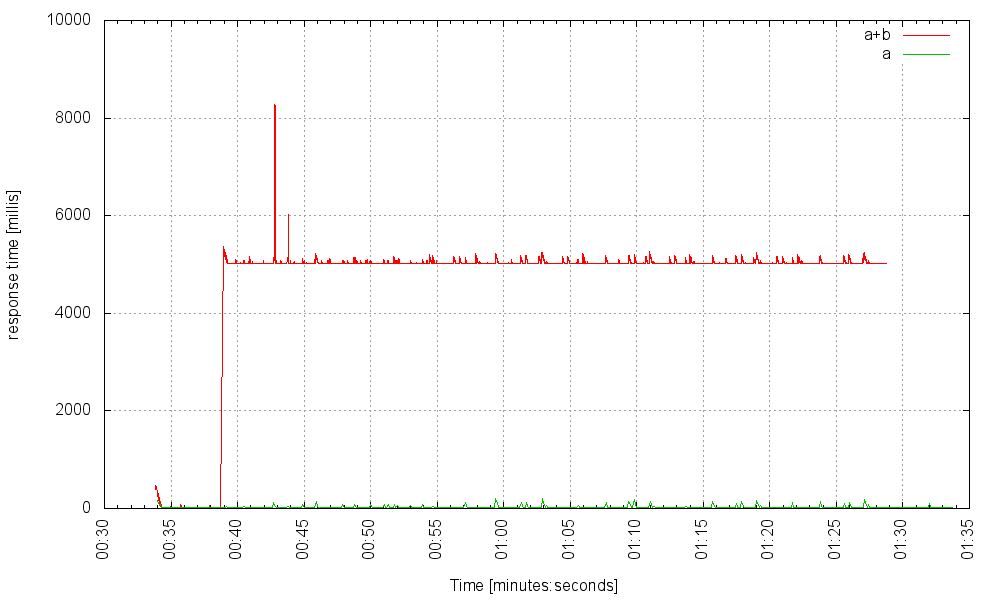
Now let’s suppose that at some point, service B experiences a failure which causes B to respond with a much increased latency; say, 5000 ms. If every second we hit the server with 300 requests that trigger services A and B, and an additional 10 requests that trigger only A (this is the control group), the service performs as it should: those requests triggering B experience increased latency, but those bypassing it remain unaffected.
But if we then increase the request rate to 400Hz, something bad happens:
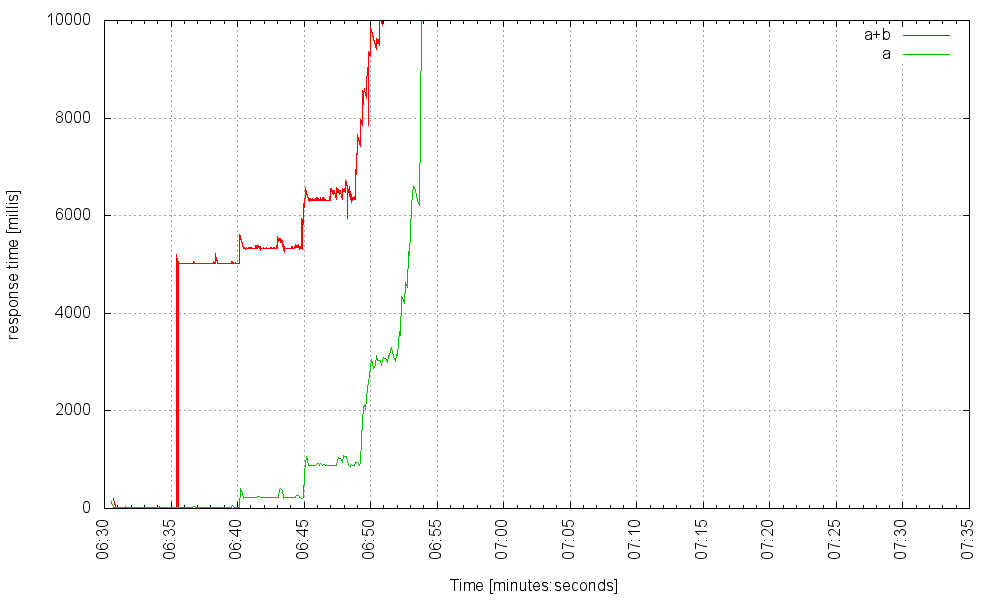
What’s going on here? When service B fails, those requests to the main service that trigger it block for a long time, each of them holding onto a thread that can’t be returned to the server’s thread pool until the request completes. The threads start piling up until they exhaust the server’s thread pool, at which point no request – even one which doesn’t attempt to use the failed service – can go through and the server essentially crashes. This is known as a cascading failure. A single failed microservice can bring down the entire application. What can we do to mitigate such failures?
We can try to increase the maximum thread pool size further but up to a (rather low) limit. OS threads place two types of burden on the system: First, their stacks consume relatively a large amount of RAM; responsive applications are much better off using that RAM to store a data cache. Second, scheduling many threads onto relatively few CPU cores adds non-negligible overhead. If the server performs very little CPU-intensive computation (as is often the case; the server usually just collects data from other sources) the scheduling overhead can become substantial.
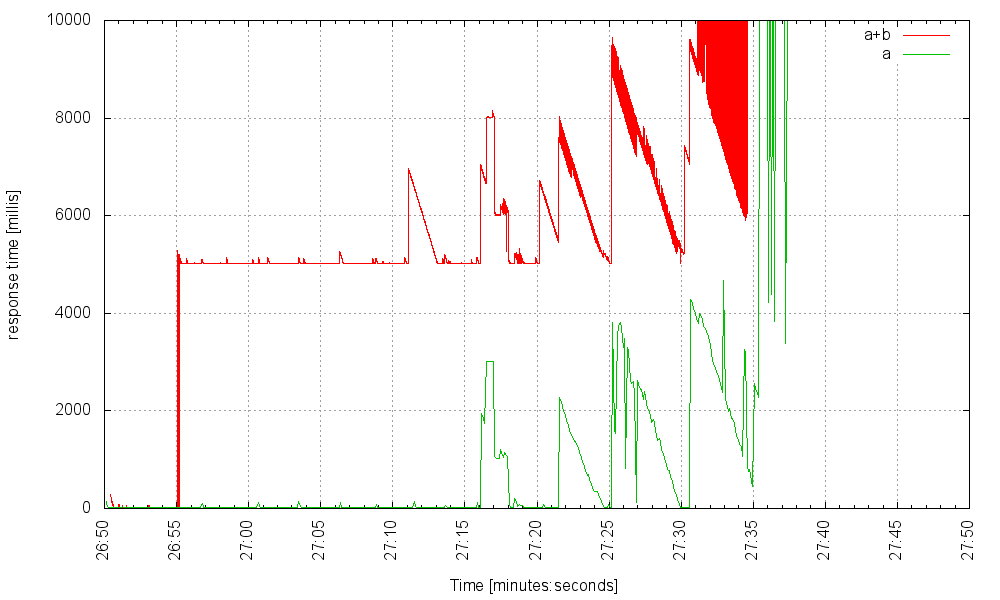
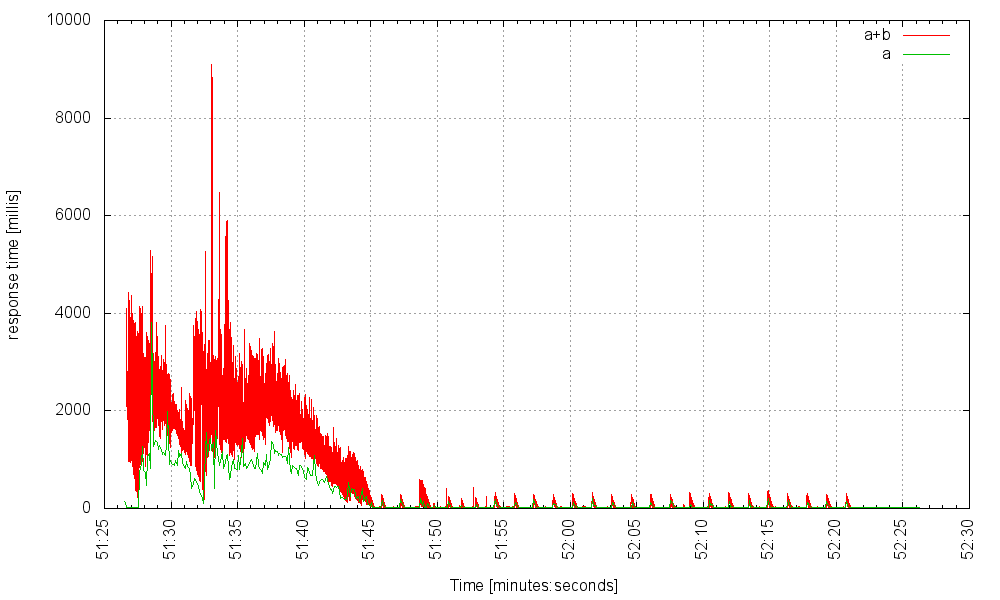
When we increase the thread pool size to 5000, our server fares better. At a rate of 500Hz it still functions well:
At 700 Hz it teeters on the brink:
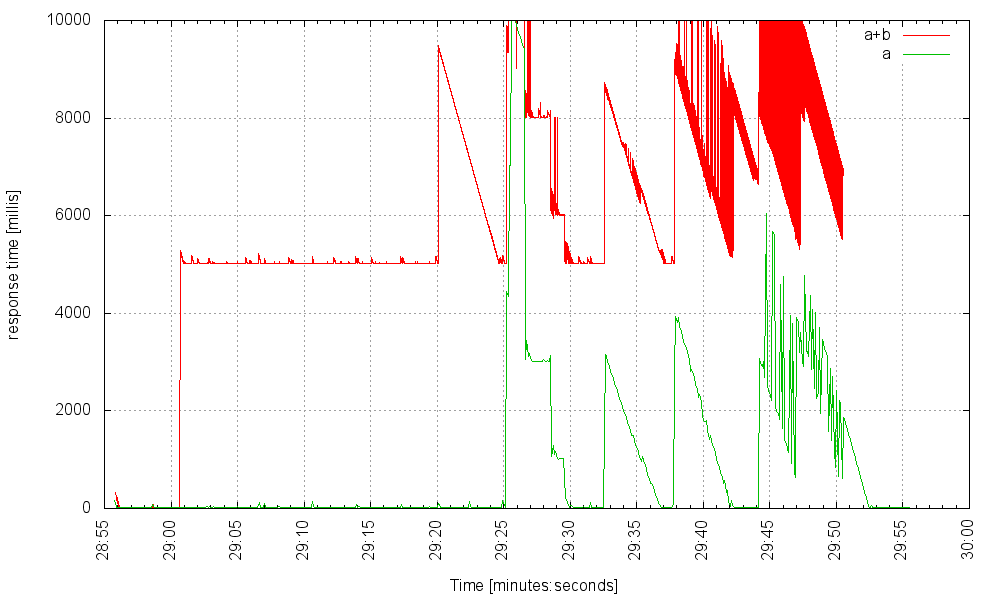
… and crashes when we increase the rate. But once we increase the thread pool size to 6000, additional threads don’t help. Here is the server with 6000 threads at 1100Hz:
And here it is with 7000 threads, handling the same load:
We can try to put a timeout on the microservice calls. Timeouts are always a good idea, but what timeout value to choose? Too low, and we might have made our application less available than it can be; too high and we haven’t really solved the problem.
We can also install a circuit breaker, like Netfilx’s Hystrix, which will attempt to quickly notice the problem and isolate the failed microservice. Circuit breakers, like timeouts, are always a good idea, but if we can significantly increase our circuit’s capacity we should probably do that (and still install a circuit breaker, just to be on the safe side).
Now let’s see how the asynchronous approach fares.
Benchmarking the Asynchronous Approach
The asynchronous approach doesn’t assign a thread per connection, but uses a small number of threads to handle a large number of IO events. The Servlet standard now sports an asynchronous API in addition to the blocking one, but because no one likes callbacks (especially in a multithreaded environment with shared mutable state), very few people use it. The Play framework also has an asynchronous API, and in order to relieve some of the pain invariably associated with asynchronous code, Play replaces plain callbacks with functional programming monadic compositions. The Play API is not only non standard, it also feels very foreign to Java developers. It also doesn’t help reduce the problems associated with running asynchronous code in an environment that doesn’t protect against race conditions. In short, asynchronous code is a pain in the ass.
But, we can still test this approach’s behavior while keeping our code nice, simple and blocking, by using fibers. We would still be using asynchronous IO, but the ugliness would be all hidden from us.
Benchmarking the Asynchronous Fiber Approach
Comsat is an open-source project integrating standard or popular web related APIs with Quasar fibers. Here’s our service, now utilizing Comsat (full class here):
@Singleton
@Path("/service")
public class Service extends HttpServlet {
    private final CloseableHttpClient httpClient;
    private static final BasicResponseHandler basicResponseHandler = new BasicResponseHandler();

    public Service() {
        httpClient = FiberHttpClientBuilder.create() // <---------- FIBER
                ...
                .build();
    }

    @GET
    @Produces("text/plain")
    @Suspendable  // <------------- FIBER
    public String get(@QueryParam("sleep") int sleep) throws IOException {
        // simulate a call to a service that always completes in 10 ms - service A
        String res1 = httpClient.execute(new HttpGet(Main.SERVICE_URL + 10), basicResponseHandler);

        // simulate a call to a service that might fail and cause a delay - service B
        String res2 = sleep > 0 ? httpClient.execute(new HttpGet(Main.SERVICE_URL + sleep), basicResponseHandler) : "skipped";

        return "call response res1: " + res1 + " res2: " + res2;
    }
}
The code is identical to our thread-blocking service, except for a couple of lines – marked with arrows – and one in the Main class.
When B performs correctly all is well (when the server serves those first few requests you’ll see some warnings printed to the console about fibers taking up too much CPU time. That’s OK. It’s simply initialization code that is executed):
Without further ado, here’s our service on fibers, (using 40 OS threads, which is Jetty’s minimum thread-pool size), at 3000Hz:
at 5000Hz:
at 6000Hz it requires some time to fully warm up, but then converges:
Now, let’s kick our problematic microservice, our dear service B, so that it experiences a 5 second latency. Here’s our server at 1000Hz:
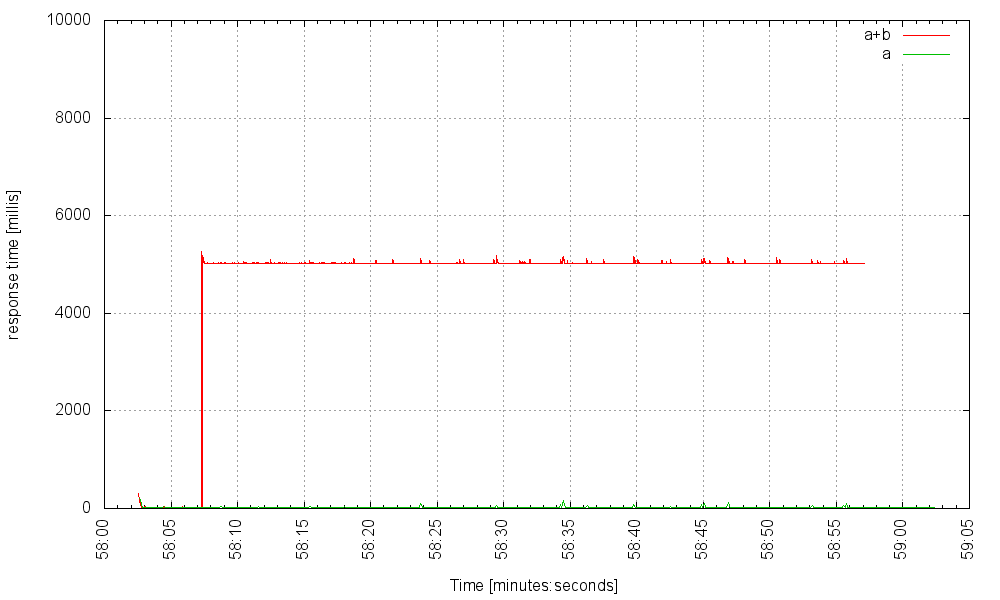
and at 2000Hz:
Still smooth sailing apart from a very occasional spike when responding to a request using the faulty service B, but those hitting A alone experience nothing. At 4000Hz it starts to show some noticeable, but not catastrophic, jitter:
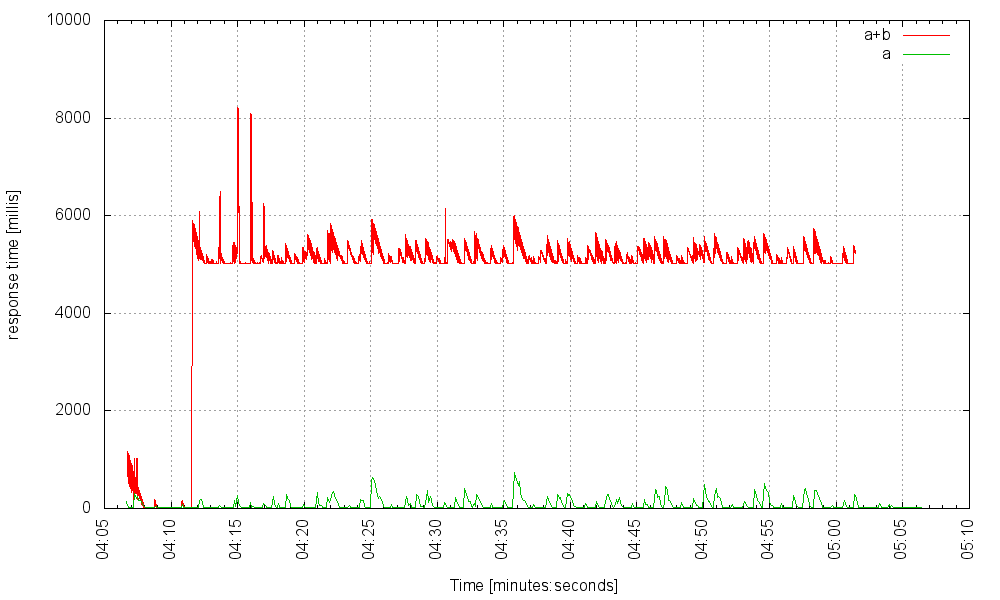
It takes 5000 requests per second (under failure conditions!) to make the server unresponsive. Heck, service B can cause a 20 second delay, and still our server can handle 1500 requests that trigger the failed service per second, and those requests not hitting the faulty service won’t even notice:
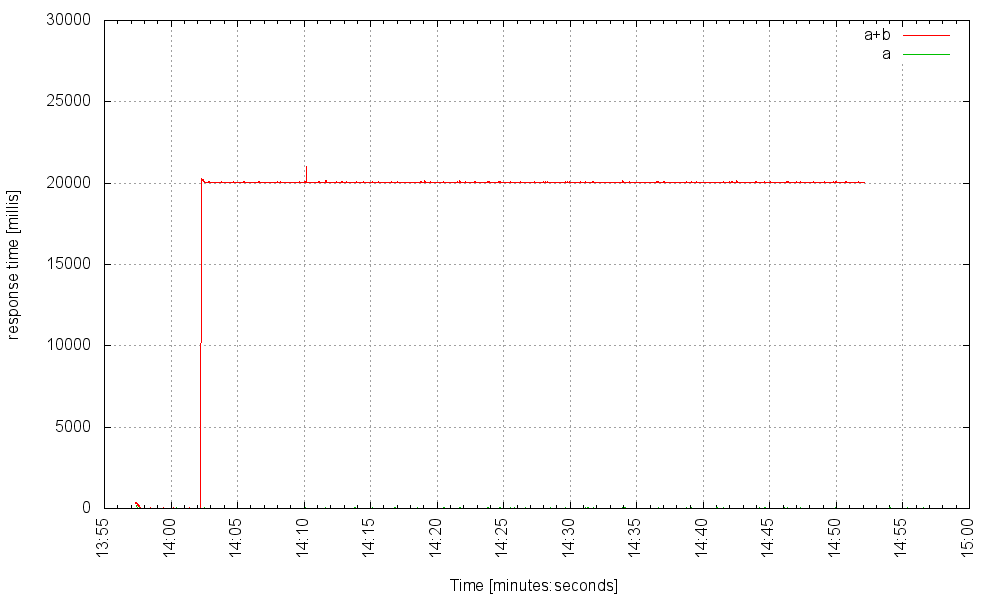
So, what’s going on here? When service B starts displaying very high latencies, the fibers serving the requests that call B pile up for a while, but because we can have so many fibers, and because their overhead is so low, the system quickly reaches a new steady state – with tens of thousands blocked fibers, but that’s perfectly OK!
Expanding Our Capacity Further
Because our web service issues outgoing requests to microservices, and because we can now service lots and lots of concurrent requests, our service might eventually hit another OS limit. Every outgoing TCP socket captures an ephemeral port. We’ve set up net.ipv4.ip_local_port_range to be 1024 65535 for a total of 65535 – 1024 = 64511 outgoing connections, but our service can handle a lot more. Unfortunately we can’t raise this limit any higher, but because this limit is per network interface, what we can do is define virtual interfaces, and make outgoing requests choose an interface at random or based on some logic.
In Conclusion
Fibers give use the ability to enjoy asynchronous IO while keeping to simple, and standard, code. What we gain with async IO, then, is not reduced latency (which we haven’t benchmarked, but there’s little reason to believe it is much better than plain thread-blocking IO) but significantly increased capacity. The system’s steady state supports a much higher load. Asynchronous IO leads to better utilization of hardware resources.
Naturally, this approach has downsides, too. Chief among them (actually, I think it’s the only one), is library integration. Every blocking API we call on a fiber must specifically support fibers. This is not unique, by the way, to the lightweight thread approach alone: to use the asynchronous approach all IO libraries used must be asynchronous, too. In fact, if a library has an asynchronous API it can be easily turned into a fiber-blocking one. The Comsat project is a set of modules integrating standard or popular IO APIs with Quasar fibers. Comsat’s latest release supports servlets, JAX-RS servers and clients, and JDBC. The upcoming release (and the one used in the benchmark) will add support for Apache HTTP client, Dropwizard, JDBI, Retrofit and possibly jOOQ.
| Reference: | Scalable, Robust – and Standard – Java Web Services with Fibers from our JCG partner Ron Pressler at the Parallel Universe blog. |

What resource were you running out of when you cranked up the number of threads to 7K? Were you CPU bound at that point or something else?
It’d be nice to at least parse some json from your mock microservice since most api’s don’t simply pass through the API response without any computation, so you’d get a realistic throughput number on the system you were benchmarking against.
Thanks for the article!