Here at Takipi, we’re in the error tracking business. Each day, Takipi is used to track more than 500,000 errors across hundreds of different companies. The most critical and fragile stage for many apps is just after a new deployment – when code changes are tested for the first time under a high stress load and with full production settings. Takipi detects your code changes automatically, and 87% of users report finding new unknown bugs in production via Takipi within the first hour after deploying a new version.
Takipi analyzes your code at the JVM level, and doesn’t rely on pulling log files from your machine. This helps companies collect more data on problems in production with minimal added CPU and IO overhead.
How can you deploy more safely?
- Track all new server errors – uncaught and caught exceptions, logged errors and HTTP errors. Easily see a list of all errors that occurred for the first time after a new deployment. Takipi automatically identifies new deployments (based on changes to existing code or new code added) and tells you if exceptions were thrown from modified code.
- Real-time analytics give you all the stats you need to decide whether an error is critical or not.
- See how new deployments affect your code. Know if an exception that used to happen 10 times a day is now occurring 1000 times a day.
- Make sure an error you patched was indeed fixed and doesn’t spring up again.
How does it work?
Takipi is a Java agent that monitors all production errors and shows all the code and variable values that led to them. Right after an error is detected, Takipi will display all the data you need to prioritize it and fix it.
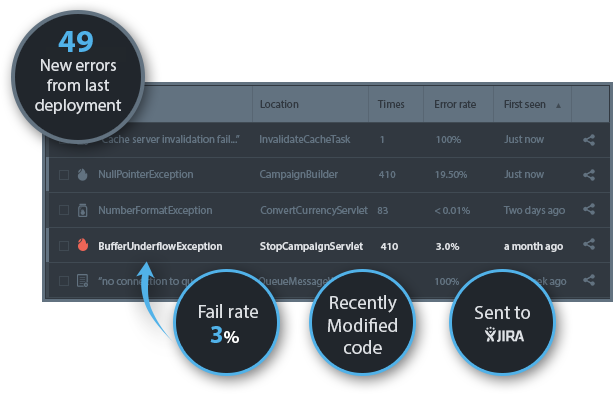
See a list of errors that started after a new deployment
For each error, get the following stats:
- Error location and root location.
- How many times it happened and the fail rate.
- Does it involve recently modified code?
- Which server threw the error
View a sample error analysis right here.
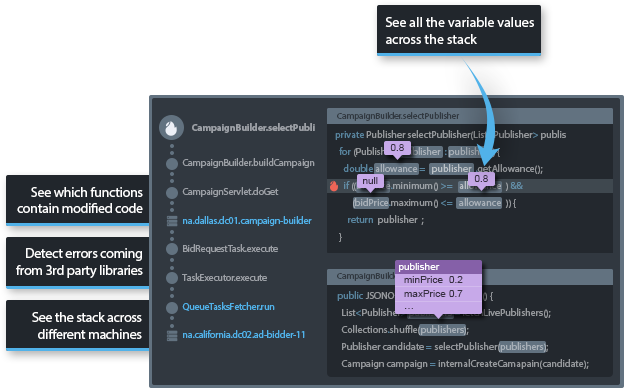
See the exact stack and variable values as they were when the error occurred
Takipi’s core technology is around creating a full “replay” of each exception. You can see the entire call stack, including 3rd party methods if desired, and click on each method to view the variable values as they were when the exception happened. Takipi records all variable types and captures them up to 5 levels deep in the heap.
Compare an error between different code versions. Know if it happens more often than it used to
Takipi shows you error trends – allowing you to compare the number of errors and fail rates across different deployments. If an error happened multiple times (the usual case), you can view historical records of the same error and compare values, even between different code versions.
Get daily trends summary – know if something bad started
Once a day (or at a frequency you decide) Takipi produces a summary of server errors that might indicate a critical problem for you to review.
These summaries show you a list of new errors that started today and where they’re coming from. Get highlights on errors that have increased dramatically and are now happening more frequently than before.
View errors coming from 3rd party code.
Your code doesn’t exist in a vacuum. Sometimes, the reason for your code breaking lies with changes to 3rd party libraries. In these cases, it can take a long time to understand what happened. In Takipi, you can add monitoring for 3rd party libraries and install it on code bases like Hadoop/Spark/Kafka to discover exception coming from there. If an API becomes unavailable or slows down, you can know right away.
| Reference: | Deploying Code Fast? Here’s How to Tell If You Broke Something from our JCG partner Iris Shoor at the Takipi blog. |