While working with the GC pause detection functionality in Plumbr I was forced to work my way through loads of articles, books and presentations about the subject. Throughout the journey, I was repeatedly confused about the (mis)use of the Minor, Major and Full GC events. This led to this blog post where I hope I manage to clear some of this confusion.
The post expects the reader to be familiar with generic garbage collection principles built into the JVM. Division of Heap into Eden, Survivor and Tenured/Old spaces, generational hypothesis and different GC algorithms are beyond the scope of this post.
Minor GC
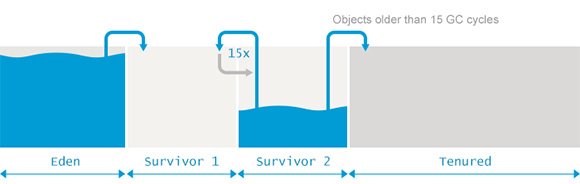
Collecting garbage from Young space (consisting of Eden and Survivor spaces) is called a Minor GC. This definition is both clear and uniformly understood. But there are still some interesting take-aways you should be aware of when dealing with Minor Garbage Collection events:
- Minor GC is always triggered when JVM is unable to allocate space for a new Object, e.g. the Eden is getting full. So the higher the allocation rate, the more frequently Minor GC is executed.
- Whenever the pool is filled, its entire content is copied and the pointer can start tracking the free memory from zero again. So instead of classical Mark, Sweep and Compact, cleaning Eden and Survivor spaces is carried out with Mark and Copy instead. So, no fragmentation actually takes place inside Eden or Survivor spaces. The write pointer is always residing on the top of the used pool.
- During a Minor GC event, Tenured generation is effectively ignored. References from tenured generation to young generation are considered de facto GC roots. References from young generation to Tenured generation are simply ignored during the markup phase.
- Against common belief, all Minor GCs do trigger stop-the-world pauses, stopping the application threads. For most of the applications, the length of the pauses is negligible latency-wise. This is true if most of the objects in Eden can be considered garbage and are never copied to Survivor/Old spaces. If the opposite is true and most of the newborn objects are not eligible for GC, Minor GC pauses start taking considerably more time.
So with Minor GC the situation was rather clear – every Minor GC cleans the Young generation.
Major GC vs Full GC
One should notice that there is no formal definitions present for those terms. Neither in JVM specification nor in the Garbage Collection research papers. But on the first glance, building these definitions on top of what we know to be true about Minor GC cleaning Young space should be simple:
- Major GC is cleaning the Tenured space.
- Full GC is cleaning the entire Heap – both Young and Tenured spaces.
Unfortunately it is a bit more complex and confusing. To start with – many Major GCs are triggered by Minor GCs, so separating the two is impossible in many cases. On the other hand – many modern garbage collections perform cleaning the Tenured space partially, so again, using the term “cleaning” is only partially correct.
This leads us to the point where instead of worrying whether the GC is called Major or Full GC, you should focus to finding out whether the GC at hand stopped all the application threads or was it able to progress concurrently with the application threads.
This confusion is even built right into the JVM standard tools. What I mean by that is best explained via an example. Lets compare the output of two different tools tracing the GC on a JVM running with Concurrent Mark and Sweep collector (-XX:+UseConcMarkSweepGC)
First attempt is to get the insight via the jstat output:
my-precious: me$ jstat -gc -t 4235 1s
Time S0C    S1C    S0U    S1U      EC       EU        OC         OU       MC     MU    CCSC   CCSU   YGC     YGCT    FGC    FGCT     GCT
 5.7 34048.0 34048.0  0.0   34048.0 272640.0 194699.7 1756416.0   181419.9  18304.0 17865.1 2688.0 2497.6      3    0.275   0      0.000    0.275
 6.7 34048.0 34048.0 34048.0  0.0   272640.0 247555.4 1756416.0   263447.9  18816.0 18123.3 2688.0 2523.1      4    0.359   0      0.000    0.359
 7.7 34048.0 34048.0  0.0   34048.0 272640.0 257729.3 1756416.0   345109.8  19072.0 18396.6 2688.0 2550.3      5    0.451   0      0.000    0.451
 8.7 34048.0 34048.0 34048.0 34048.0 272640.0 272640.0 1756416.0  444982.5  19456.0 18681.3 2816.0 2575.8      7    0.550   0      0.000    0.550
 9.7 34048.0 34048.0 34046.7  0.0   272640.0 16777.0  1756416.0   587906.3  20096.0 19235.1 2944.0 2631.8      8    0.720   0      0.000    0.720
10.7 34048.0 34048.0  0.0   34046.2 272640.0 80171.6  1756416.0   664913.4  20352.0 19495.9 2944.0 2657.4      9    0.810   0      0.000    0.810
11.7 34048.0 34048.0 34048.0  0.0   272640.0 129480.8 1756416.0   745100.2  20608.0 19704.5 2944.0 2678.4     10    0.896   0      0.000    0.896
12.7 34048.0 34048.0  0.0   34046.6 272640.0 164070.7 1756416.0   822073.7  20992.0 19937.1 3072.0 2702.8     11    0.978   0      0.000    0.978
13.7 34048.0 34048.0 34048.0  0.0   272640.0 211949.9 1756416.0   897364.4  21248.0 20179.6 3072.0 2728.1     12    1.087   1      0.004    1.091
14.7 34048.0 34048.0  0.0   34047.1 272640.0 245801.5 1756416.0   597362.6  21504.0 20390.6 3072.0 2750.3     13    1.183   2      0.050    1.233
15.7 34048.0 34048.0  0.0   34048.0 272640.0 21474.1  1756416.0   757347.0  22012.0 20792.0 3200.0 2791.0     15    1.336   2      0.050    1.386
16.7 34048.0 34048.0 34047.0  0.0   272640.0 48378.0  1756416.0   838594.4  22268.0 21003.5 3200.0 2813.2     16    1.433   2      0.050    1.484
This snippet is extracted from the first 17 seconds after the JVM was launched. Based on this information we could conclude that after 12 Minor GC runs two Full GC runs were performed, spanning 50ms in total. You would get the same confirmation via GUI-based tools, such as the jconsole or jvisualvm.
Before nodding to this conclusion, lets look at to the output of the garbage collection logs gathered from the same JVM launch. Apparently -XX:+PrintGCDetails tells us a different and more detailed story:
java -XX:+PrintGCDetails -XX:+UseConcMarkSweepGC eu.plumbr.demo.GarbageProducer
3.157: [GC (Allocation Failure) 3.157: [ParNew: 272640K->34048K(306688K), 0.0844702 secs] 272640K->69574K(2063104K), 0.0845560 secs] [Times: user=0.23 sys=0.03, real=0.09 secs]
4.092: [GC (Allocation Failure) 4.092: [ParNew: 306688K->34048K(306688K), 0.1013723 secs] 342214K->136584K(2063104K), 0.1014307 secs] [Times: user=0.25 sys=0.05, real=0.10 secs]
... cut for brevity ...
11.292: [GC (Allocation Failure) 11.292: [ParNew: 306686K->34048K(306688K), 0.0857219 secs] 971599K->779148K(2063104K), 0.0857875 secs] [Times: user=0.26 sys=0.04, real=0.09 secs]
12.140: [GC (Allocation Failure) 12.140: [ParNew: 306688K->34046K(306688K), 0.0821774 secs] 1051788K->856120K(2063104K), 0.0822400 secs] [Times: user=0.25 sys=0.03, real=0.08 secs]
12.989: [GC (Allocation Failure) 12.989: [ParNew: 306686K->34048K(306688K), 0.1086667 secs] 1128760K->931412K(2063104K), 0.1087416 secs] [Times: user=0.24 sys=0.04, real=0.11 secs]
13.098: [GC (CMS Initial Mark) [1 CMS-initial-mark: 897364K(1756416K)] 936667K(2063104K), 0.0041705 secs] [Times: user=0.02 sys=0.00, real=0.00 secs]
13.102: [CMS-concurrent-mark-start]
13.341: [CMS-concurrent-mark: 0.238/0.238 secs] [Times: user=0.36 sys=0.01, real=0.24 secs]
13.341: [CMS-concurrent-preclean-start]
13.350: [CMS-concurrent-preclean: 0.009/0.009 secs] [Times: user=0.03 sys=0.00, real=0.01 secs]
13.350: [CMS-concurrent-abortable-preclean-start]
13.878: [GC (Allocation Failure) 13.878: [ParNew: 306688K->34047K(306688K), 0.0960456 secs] 1204052K->1010638K(2063104K), 0.0961542 secs] [Times: user=0.29 sys=0.04, real=0.09 secs]
14.366: [CMS-concurrent-abortable-preclean: 0.917/1.016 secs] [Times: user=2.22 sys=0.07, real=1.01 secs]
14.366: [GC (CMS Final Remark) [YG occupancy: 182593 K (306688 K)]14.366: [Rescan (parallel) , 0.0291598 secs]14.395: [weak refs processing, 0.0000232 secs]14.395: [class unloading, 0.0117661 secs]14.407: [scrub symbol table, 0.0015323 secs]14.409: [scrub string table, 0.0003221 secs][1 CMS-remark: 976591K(1756416K)] 1159184K(2063104K), 0.0462010 secs] [Times: user=0.14 sys=0.00, real=0.05 secs]
14.412: [CMS-concurrent-sweep-start]
14.633: [CMS-concurrent-sweep: 0.221/0.221 secs] [Times: user=0.37 sys=0.00, real=0.22 secs]
14.633: [CMS-concurrent-reset-start]
14.636: [CMS-concurrent-reset: 0.002/0.002 secs] [Times: user=0.00 sys=0.00, real=0.00 secs]
Based on this information we can see that indeed after 12 Minor GC runs “something different” started happening. But instead two Full GC runs, this “different thing” was in reality just a single GC running in Tenured generation consisting of different phases:
- Initial Mark phase, spanning for 0.0041705 seconds or approximately 4ms. This phase is a stop-the-world event stopping all application threads for initial marking.
- Concurrenty executed Markup and Preclean phases. These are run concurrently with the application threads
- Final Remark phase, spanning for 0.0462010 seconds or approximately 46ms. This phase is again stop-the-world event.
- Concurrently executed Sweep operation. As the name states, this phase is also carried out concurrently without stopping the application threads.
So what we see from the actual garbage collection logs is that – instead two Full GC operations, just one Major GC cleaning Old space was actually executed.
If you were after latency then making the decisions based upon the data revealed by jstat would have led you towards correct decisions. It correctly listed the two stop-the-world events totaling 50ms affecting the latency for all the active threads at that very moment. But if you were trying to optimize for throughput, you would have been misguided – listing just the stop-the-world initial mark and final remark phases, the jstat output completely hides the concurrent work being done.
Conclusion
Considering the situation, it is best to even avoid thinking in terms of Minor, Major or Full GC. Instead, monitor your application for latency or throughput and link the GC events to the results. Along with these events, you need to have the information whether the particular GC event forced all the application threads to stop or was part of the event handled concurrently.
If you enjoyed the content – this is the example chapter from our Garbage Collection Handbook. Entire handbook is about to release during March 2015.
| Reference: | Minor GC vs Major GC vs Full GC from our JCG partner Nikita Salnikov Tarnovski at the Plumbr Blog blog. |

Note it is generational garbage collection, not generic.