![]() When implementing services using the WSO2 stack (or any other open source Java framework) you will sooner or later run into a situation that the framework behaviour doesn’t do what you expect it should do. Or you just want to verify the way a product works. I lately had several of these experiences and I got around it to setup a remote debug session so I could go through the code step-by-step to see what exactly was happening. Of course this only makes sense if you have the source code available (long live open source :-)). In this post an example with the WSO2 ESB (v 4.8.1) in combination with IntelliJ IDEA.
When implementing services using the WSO2 stack (or any other open source Java framework) you will sooner or later run into a situation that the framework behaviour doesn’t do what you expect it should do. Or you just want to verify the way a product works. I lately had several of these experiences and I got around it to setup a remote debug session so I could go through the code step-by-step to see what exactly was happening. Of course this only makes sense if you have the source code available (long live open source :-)). In this post an example with the WSO2 ESB (v 4.8.1) in combination with IntelliJ IDEA.
First step is to get the source code of the WSO2 ESB, the way to do this is described here. When we have the downloaded the sources we can also download the binary to have the ESB running locally on our machine (By the way, I also tried to build the WSO2 stack from the sources but after few hours of trying I never got it successfully completed). When we have both the sources and binary in place we can start our debug session. First start the WSO2 ESB by going to the following directory ‘$ESB_HOME/bin’ and perform the command ‘./wso2server.sh -debug 5005′, like this:
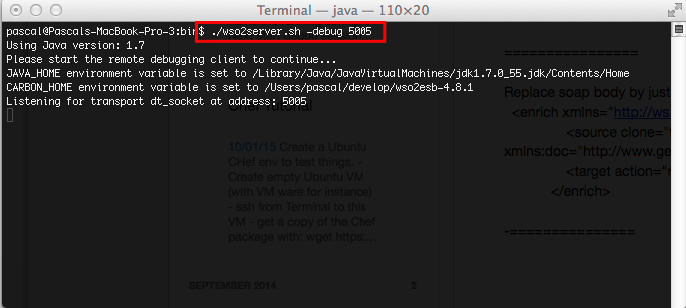
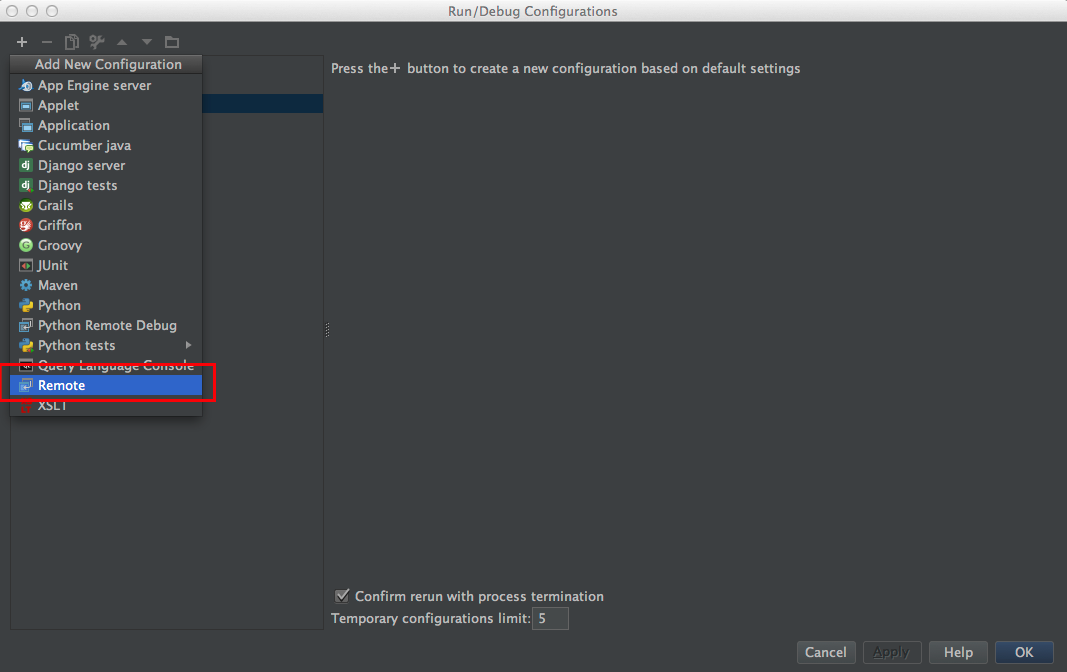
As you can see the process of starting the ESB is paused until a debug session at port 5005 is started. Now go to IntelliJ IDEA (or I assume other IDE’s also support this) and create a new running configuration like:
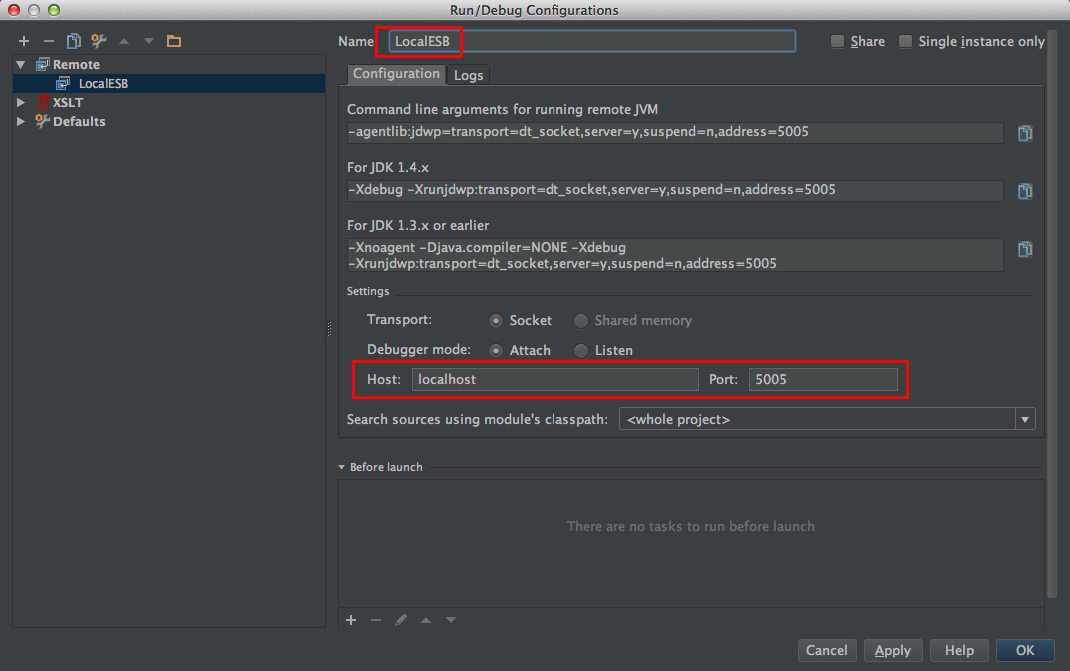
In the configuration I only change the name of the config. As you can see the default server and port are the correct ones in my case:
After saving the configuration we can start the debug session by clicking the ‘bug’ in the menu bar:

When the session is started we see the following line in IntelliJ console:
Connected to the target VM, address: 'localhost:5005', transport: 'socket' And we see that the WSO2 ESB has continued starting.
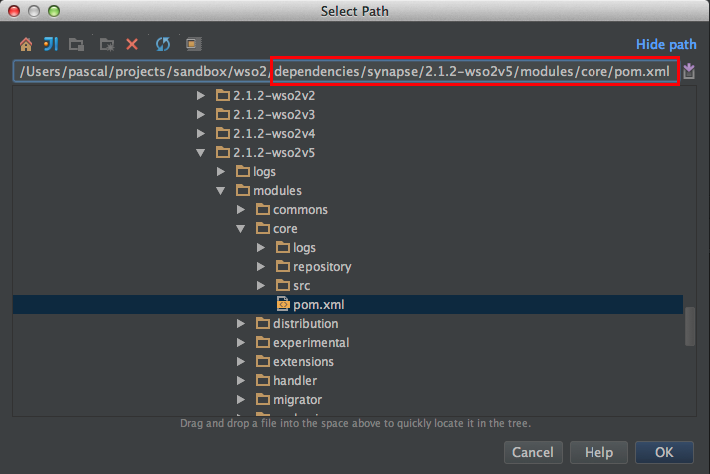
Now comes the hardest part and that is to place the breakpoint at the correct place in the source code, since there is a lot of it in the WSO2 stack :-). Best is if you have a stack trace pointing you to a certain class. Another common place to set a breakpoint are the builtin mediators. The pom.xml for this component can be found in ‘$SRC_HOME/dependencies/synapse/2.1.2-wso2v5/modules/core’. So import this pom.xml in your IntelliJ:
Browse to the class ‘org.apache.synapse.mediators.builtin.LogMediator.java’ and set a breakpoint at the ‘mediate’ method:
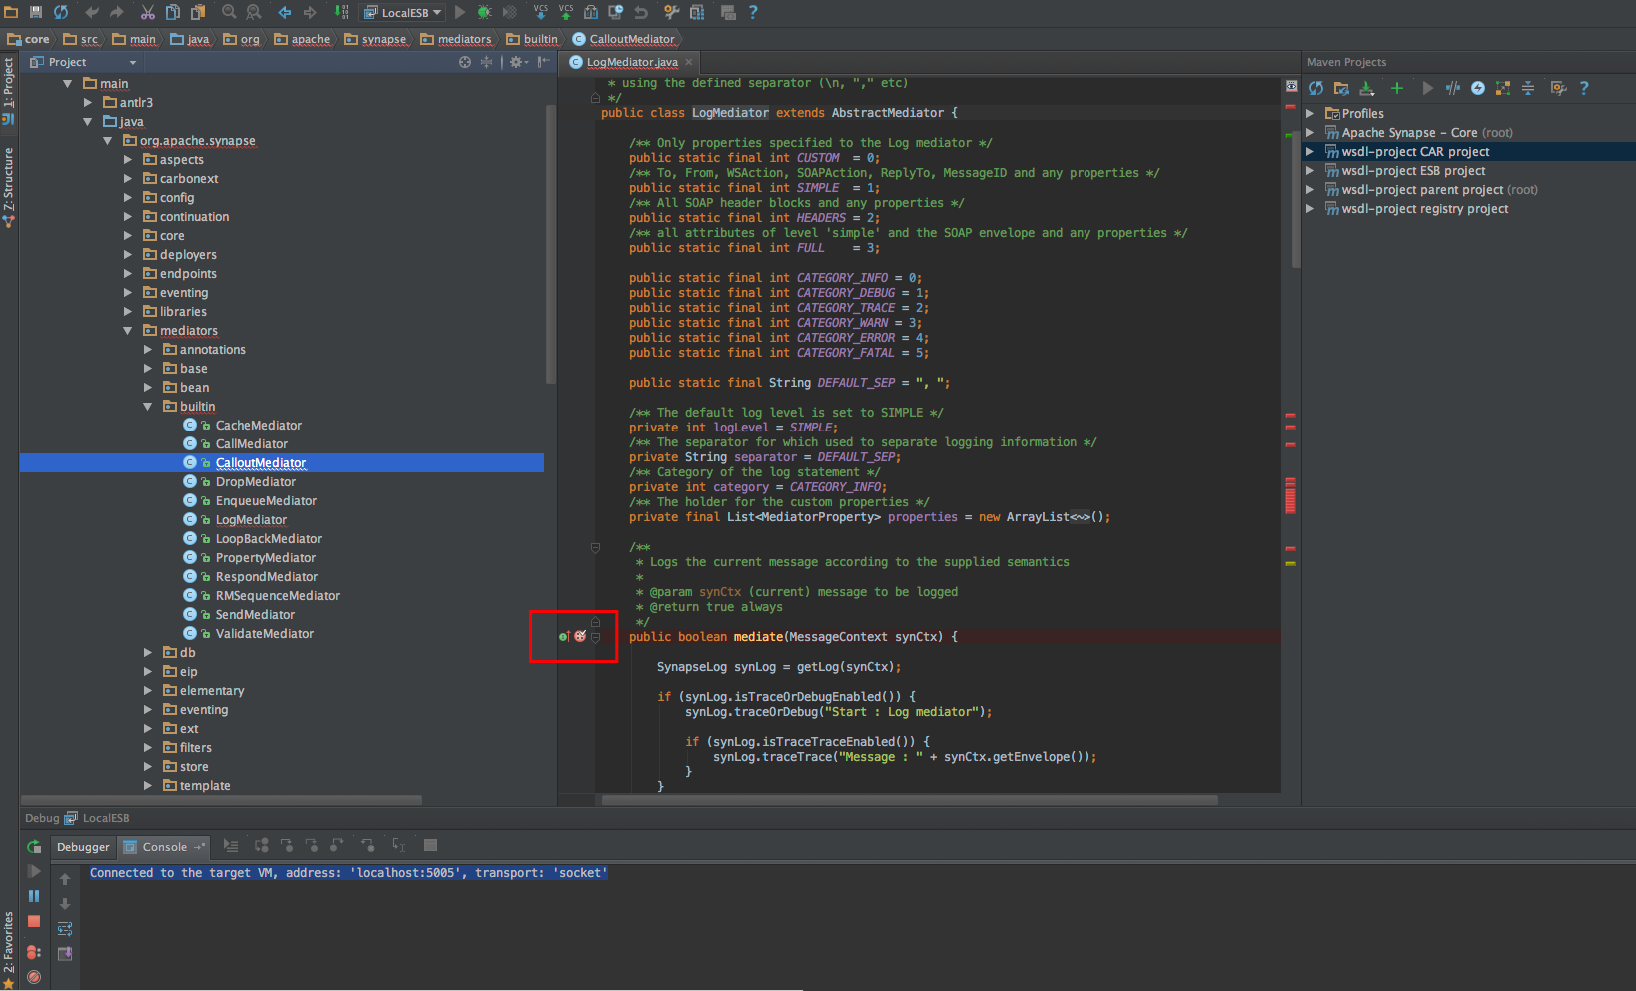
Now make sure the mediator is called by the ESB and you will see that IntelliJ will get the focus as soon as the code reaches the breakpoint:
 Now from this point on you can step through the execution of the code and see why things are happening the way they do.
Hopefully this will help you like it helped me in several occasions where I didn’t find any help in the documentation or Google.
| Reference: | Making use of the open sources of WSO2 ESB from our JCG partner Pascal Alma at the The Pragmatic Integrator blog. |
