Overview
The main question around the use of Lambdas in Java and Low Latency is; Does they produce garbage and is there anything you can do about it?
Background
I am working on a library which supports different wire protocols. The idea being that you can describe the data you want to write/read and the wire protocol determines if it uses text with fields like JSon or YAML, text with field numbers like FIX, binary with field names like BSON or a Binary form of YAML, binary with fields name, field numbers or no field meta at all. The values can be fixed length, variables length and/or self describing data types.
The idea being that it can handle a variety of schema changes or if you can determine the schema is the same e.g. over a TCP session, you can skip all that and just send the data.
Another big idea is using lambdas to support this.
What is the problem with Lambdas
The main issue is the need to avoid significant garbage in low latencies applications. Notionally, every time you see lambda code this is a new Object.
Fortunately, Java 8 has significantly improved Escape Analysis. Escape Analysis allows the JVM to replace new Object by unpacking them onto the stack, effectively giving you stack allocation. This feature was available in Java 7 however it rarely eliminated objects. Note: when you use a profiler it tends to prevent Escape Analysis from working so you can’t trust profilers that use code injection as the profiler might say an object is being creation when without the profiler it doesn’t create an object. Flight Recorder does appear to mess with Escape Analysis.
Escape Analysis has always had quirks and it appears that it still does. For example, if you have an IntConsumer or any other primitive consumer, the allocation of the lambda can be eliminated in Java 8 update 20 – update 40. However, the exception being boolean where this doesn’t appear to happen. Hopefully this will be fixed in a future version.
Another quirk is that the size (after inlining) of the method where the object elimination occurs matters and in relatively modest methods, escape analysis can give up.
A specific case
In my case I have a read method which looks like this:
public void readMarshallable(Wire wire) throws StreamCorruptedException {
    wire.read(Fields.I).int32(this::i)
            .read(Fields.J).int32(this::j)
            .read(Fields.K).int32(this::k)
            .read(Fields.L).int32(this::l)
            .read(Fields.M).int32(this::m)
            .read(Fields.N).int32(this::n)
            .read(Fields.O).int32(this::o)
            .read(Fields.P).int32(this::p)
            .read(Fields.Q).int32(this::q)
            .read(Fields.R).int32(this::r)
            .read(Fields.S).int32(this::s)
            .read(Fields.T).int32(this::t)
            .read(Fields.U).int32(this::u)
            .read(Fields.V).int32(this::v)
            .read(Fields.W).int32(this::w)
            .read(Fields.X).int32(this::x)
    ;
}
I am using lambdas for setting the fields the framework can handle optional, missing or out of order fields. In the optimal case, the fields are available in the order provided. In the case of a schema change, the order may be different or have a different set of fields. The use of lambdas allows the framework to handle in order and out of order fields differently.
Using this code, I performed a test, serializing and deserializing the object 10 million times. I configured the JVM to have an eden size of 10 MB with -Xmn14m -XX:SurvivorRatio=5 The Eden space 5x the two survivor spaces with ratio 5:2. The Eden space is 5/7th of the total young generation i.e. 10 MB.
By having an Eden size of 10 MB and 10 million tests I can estimate the garbage created by counting the number of GCs printed by -verbose:gc For every GC I get, an average of one byte per test was crated. When I varied the number of fields serialized and deserialized I got the following result on an Intel i7-3970X.
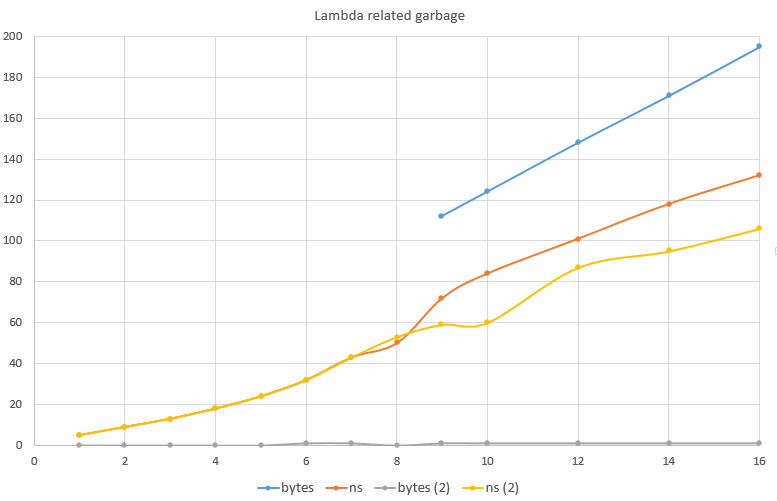
In this chart you can see that for 1 to 8 fields deserialized i.e. up to 8 lambdas in the same method, there is almost no garbage created i.e. at most one GC. However at 9 or more fields or lambdas, the escape analysis fails and you get garbage being created, increasing linearly with the number of fiedls.
I wouldn’t want you to believe that 8 is some magic number. It is far more likely to be a limit of the size in bytes of the method, though I couldn’t find such a command line setting. The difference occurs when the method grew to 170 bytes.
Is there anything which can be done? The simplest “fix” turned out to be breaking the code into two methods (possibly more if needed) by deserializing half the fields in one method and half the fields in another, it was able to deserialize 9 to 16 fields without garbage. This is the “bytes(2)” and “ns (2)” results. By eliminating garbage the code also runs faster on average.
Note: the time to serialize and deserialize an object with 14 x 32-bit integer was under 100 ns.
Other notes:
When I used a profiler, YourKit in this case, code which produced no garbage started producing garbage as the Escape Analysis failed.
I printed the method inlining and found assert statements in some key methods prevented them from being inlined as it made the methods larger. I fixed this by creating a sub-class of by main class with assertions on to be created by a factory method when assertions are enabled. The default class has no assertions and no performance impact.
Before I moved these assertions I could only deserialize 7 fields without triggering garbage.
When I replaced the lambdas with anonymous inner classes, I saw similar object elimination though in most cases if you can use lambda that is preferred.
Conclusion
Java 8 appears to be much smarter at removing garbage produce by very short lived objects. This means that techniques such as passing lambdas can be an option in Low Latency applications.
EDIT
I have found the option which helps in this situation though I am not yet sure why.
If I use the option -XX:InlineSmallCode=1000 (default) and I change it to -XX:InlineSmallCode=5000 the “fixed” example above starts producing garbage, however if I reduce it to -XX:InlineSmallCode=500 even the code example I gave originally performs without producing garbage.
| Reference: | Java Lambdas and Low Latency from our JCG partner Peter Lawrey at the Vanilla Java blog. |
