The survival kit for new deployments: Tools for Java developers that frequently deploy code to production!
Takipi detects all errors in production and shows the variable values as if you were there when it happened
Deploy now and get a free T-shirt

The ultimate survival kit for new deployments
Unlike toying around with zombie apocalypse scenarios, debating the machete versus the shotgun, troubles in Java production environments are quite real, especially after new deployments (but it’s good to be ready for zombies as well). Taking this a step further, it’s much easier to get into trouble today than ever before when new code shipping cycles are cut down to weeks and sometimes days or even multiple times a day. To avoid being run down by the zombies, here’s the survival kit setup you need to fully understand the impact of new code on your system. Did anything break? Is it slowing you down? And how to fix it? Here’s the tool set and architecture to crack it once and for all.
Logging
Other than shrinking release cycles, another property of the modern development lifecycle is ever expanding log files that can reach GBs per day. Let’s say some issue arises after a new deployment: If you’d like to produce a timely response, dealing with GBs of unstructured data from multiple sources and machines is close to impossible without the proper tooling. In this space we can essentially divide the tools to the heavy duty enterprise on-premise Splunk, and its SaaS competitors like Sumo Logic, Loggly and others. There are many choices available with a similar offering so we wrote a more in-depth analysis of log management that you can read right here.
Takeaway #1: Set up a sound log management strategy to help you see beyond the pale lines of bare logfiles and react fast after new deployments.
One logging architecture we’ve found to be super useful after deploying new code is the open-source ELK stack. It’s also worth mentioning since it’s open-source and free.

So what is this ELK we’re talking about? A combination of elasticsearch’s search and analytics capabilities, Logstash as the logs aggregator and Kibana for the fancy dashboard visualization. We’ve been using it for a while, feeding it from Java through our logs and Redis, and it’s in use both by developers and for BI. Today, elasticsearch is pretty much built-in with Logstash, and Kibana is an elasticsearch product as well, making integration and setup go easy peasy.
When a new deployment rolls out, the dashboards follow custom indicators that we’ve set up about our apps health. These indicators update in real time, allowing close monitoring when freshly delivered code takes its first steps after being uploaded to production.
Takeaway #2: Search, visualization and the ease of aggregating logs from multiple sources are key factors in determining your log management strategy.
Takeaway #3: From a developer perspective, evaluating the impact of a new deployment can include BI aspects as well.
Tools to check:
- On-premise: Splunk
- SaaS: Sumo Logic
- SaaS: Loggly
- Open source: Graylog2
- Open source: Fluentd
- The ELK stack (Open source): Elasticsearch + Logstash + Kibana
- AppDynamics
- New Relic
- jClarity
- Plumbr
- Ruxit
- Dripstat
- Know which errors affect you the most – Detect 100% of code errors in production, including JVM exceptions and log errors. Use smart filtering to cut through the noise and focus on the most important errors. Over 90% of Takipi users report finding at least one critical bug in production during their first day of use.
- Spend less time and energy debugging – Takipi automatically reproduces each error and displays the code and variables that led to it – even across servers. This eliminates the need to manually reproduce errors, saves engineering time, and dramatically reduces time to resolution.
- Deploying without risk – Takipi notifies you when errors are introduced by a new version, and when fixed errors come back to haunt you.
- Takipi
- PagerDuty
- Pingdom
Performance Monitoring
So the release cycles are cutting down and log files are becoming larger, but that’s not all: The number of user requests grows exponentially and they all expect peak performance. Unless you work hard on optimizing it, simple logging will only take you this far. With that said, dedicated Application Performance Management tools are no longer considered to be a luxury and rapidly become a standard. At its essence, APM means timing how long it takes to execute different areas in the code and complete transactions – this is done either by instrumenting the code, monitoring logs, or including network / hardware metrics. Both at your backend and on the users’ devices. The first two modern APM tools that come to mind are New Relic, who just recently filed their IPO, and AppDynamics.
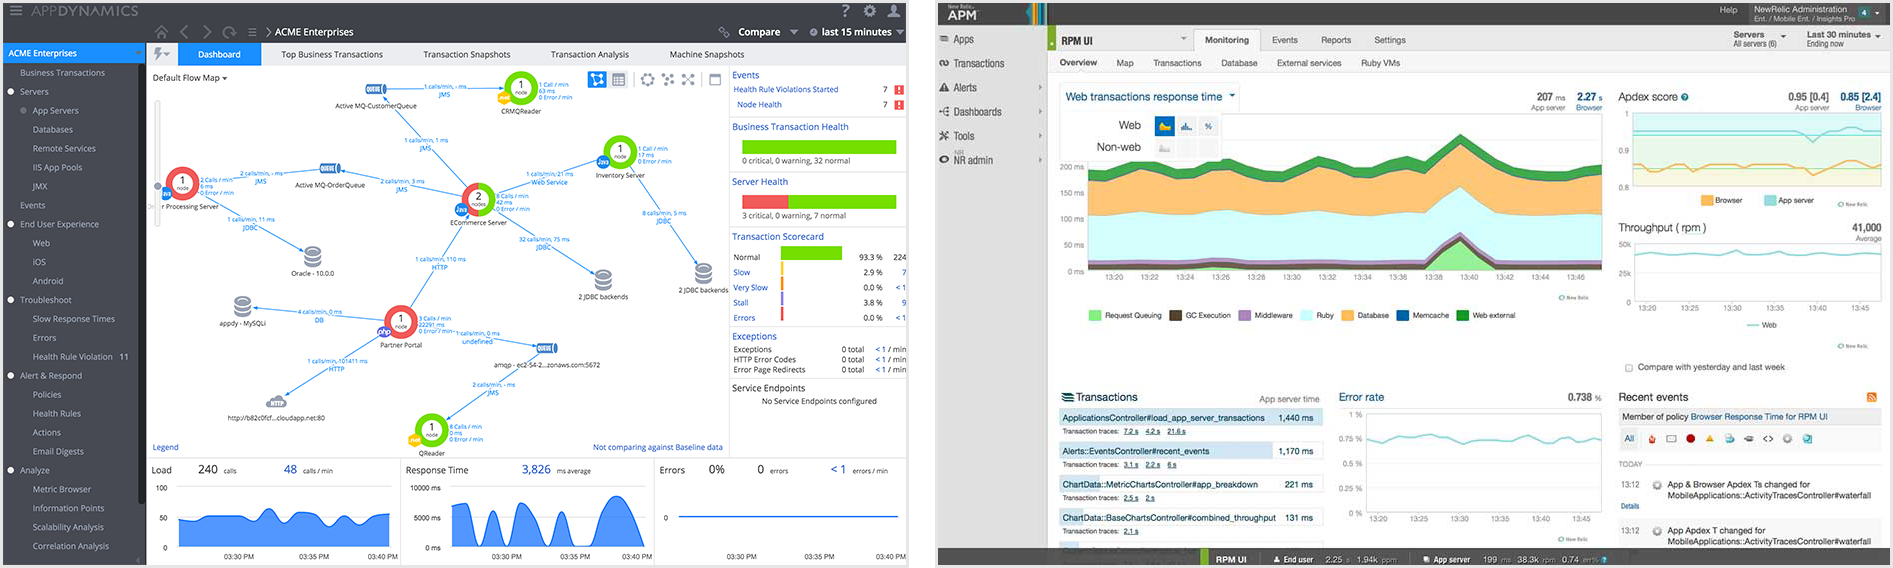
Each traditionally targeted a different type of developer, from enterprises to startups. But as both are stepping forward to their IPOs and after experiencing huge growth the lines are getting blurred. The choice is not clear, but you could not go wrong – On premise = AppDynamics, otherwise, it’s an individual call depends on which better fits your stack (and which of all the features they offer are you actually thinking you’re going to use). Check out the analysis we recently released that compares these two head to head right here.
Two additional interesting tools that were recently released are Ruxit (by Compuware) and DripStat (by Chronon Systems), each coming from larger companies with their own attempt to address the SaaS monitoring market pioneered by New Relic. Looking into hardcore JVM internals, jClarity and Plumbr are definitely worth checking out as well.
Takeaway #4: New deployments may affect your application’s performance and slow it down, APM tools can provide an all around overview of your applications health.
Tools to check:
New players:
Debugging in Production
Release cycles are down, log files grow large, user requests explode, and… the margin for error simply doesn’t exist. When an error does come – you need to be able to solve it right away. Large-scale production environments can produce millions of errors a day from hundreds of different locations in the code. While some errors may be trivial, others break critical application features and affect end-users without you knowing it. Traditionally, to identify and solve these errors you’d have to rely on your log files or a log management tool to even know an error occurred, let alone how to fix it.
With Takipi, you’re able to know which errors pose the highest risk and should be prioritized, and receive actionable information on how to fix each error.
Looking at errors arising after new deployments, Takipi addresses 3 major concerns:
Takeaway #5: With Takipi you’re able to act quickly to resolve any issue and no longer in the dark after a new release.
Tools to check:
Alerting and tracking
Release cycles, log files, user requests, no margin for error and… how you’re going to follow up on it all? You might think this category overlaps with the other’s and the truth is that you’re probably right, BUT when all of these tools have their own pipelines for letting you know what went wrong – It gets quite cluttered. Especially in the soft spot after a new deployment when all kinds of unexpected things are prone to happen (which are gentler words for… all hell breaks loose).
One of the leading incident management tools that tackles this is PagerDuty: Collecting alerts from your monitoring tools, creating schedules to coordinate your team and deliver each alert to the right person through texts, emails, sms or push notifications.
Takeaway #6: Consider using an incident management system to handle information overload.
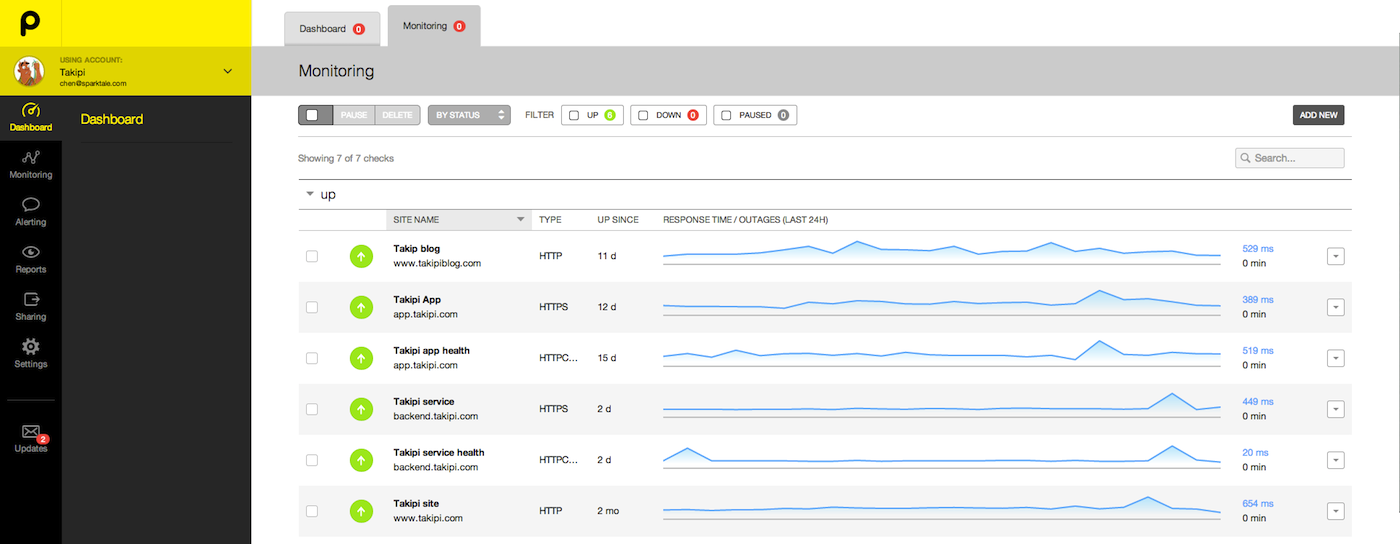
A specialized tool we really like using here is Pingdom (which also integrates with Pagerduty). What it does is quite simple and just works: Tracking and alerting on our website’s response times 24/7. Answering a crucial question that seems trivial: Is the website available? Probing it from different locations all over the globe.
Another angle to tackle information overload is error tracking that goes beyond the features of log analyzers: Smart dashboards to manage your exceptions and log errors. Aggregating data from all your servers and machines to one single place, either through your log events or other plugs coming from your code. For a deeper dive to the error tracking tools landscape, check out this post that covers the most popular options.
Takeaway #7: Code errors come in all shapes and sizes, it’s worth giving them some special treatment with an error tracking tool (and smash some bugs while we’re at it, muhaha).
Tools to check:
Conclusion
We’ve experienced first hand how modern software development affects the release lifecycle and zoomed in on how you can assess the impact of new rapid deployments – when new code can come in before you even fully understood the last update’s impact. In the grand scheme of things, any tool you consider should address these 5 characteristics:
- Shrinking release cycles
- Expanding log files
- Growing user requests
- Smaller margins for error
- Information overload
Most importantly, think of how you’re handling these today and which takes up too much of your time. Chances are that there’s a tool to solve it.
Takipi detects all errors in production and shows the variable values as if you were there when it happened
Deploy now and get a free T-shirt
| Reference: | 15 Tools Java Developers Should Use After a Major Release from our JCG partner Alex Zhitnitsky at the Takipi blog. |

You should add https://github.com/stagemonitor/stagemonitor
There are a lot of tools that can be used for montioring e.g.Anturis, Cacti, Solarwinds etc. They are all the same type, but it is much better to choose such kind of software that provides all in one monitoring as there are more chances to find the faults with the system that you have never been aware of.
I think you should also include Jrebel (http://zeroturnaround.com/software/jrebel/) , this is one of the best hot deployment plugin for java developer . I have been using it and it saves a lot of time .
Don’t forget to check security! Contrast works just like New Relic but for security. There’s also a free Eclipse plugin that you can use. http://marketplace.eclipse.org/content/contrast-eclipse.
Don’t forget to check security! Contrast works just like New Relic but for security. There’s also a free Eclipse plugin that you can use.
Javamelody https://code.google.com/p/javamelody/ is also a great open-source project for performance monitoring.
Great post. Your readers might also find real user reviews for many of these solutions on IT Central Station to be helpful.
As an example, this user writes in his review of AppDynamics, “It helps me to prioritize my activities in solving or fine-tuning the application. It helps me in my interactions with the development, infrastructure, and operations teams.” You can read the rest of his review here: https://www.itcentralstation.com/product_reviews/appdynamics-apm-review-40734-by-sriram-rajaram/tzd/c296-sbc-118.