 The concept of a graph has been around since the dawn of mechanical computing and for many decades prior in the domain of pure mathematics. Due in large part to this golden age of databases, graphs are becoming increasingly popular in software engineering. Graph databases provide a way to persist and process graph data. However, the graph database is not the only way in which graphs can be stored and analyzed. Graph computing has a history prior to the use of graph databases and has a future that is not necessarily entangled with typical database concerns. There are numerous graph technologies that each have their respective benefits and drawbacks. Leveraging the right technology at the right time is required for effective graph computing.
Structure: Modeling Real-World Scenarios with Graphs

A graph (or network) is a data structure. It is composed of vertices (dots) and edges (lines). Many real-world scenarios can be modeled as a graph. This is not necessarily inherent to some objective nature of reality, but primarily predicated on the the fact that humans subjectively interpret the world in terms of objects (vertices) and their respective relationships to one another (edges) (an argument against this idea). The popular data model used in graph computing is the property graph. The following examples demonstrate graph modeling via three different scenarios.
A Software Graph
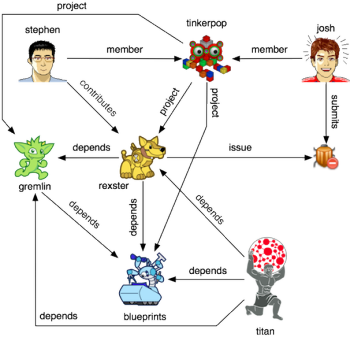
Stephen is a member of a graph-oriented engineering group called TinkerPop. Stephen contributes to Rexster. Rexster is related to other projects via software dependencies. When a user finds a bug in Rexster, they issue a ticket. This description of a collaborative coding environment can be conveniently captured by a graph. The vertices (or things) are people, organizations, projects, and tickets. The edges (or relationships) are, for example, memberships, dependencies, and issues. A graph can be visualized using dots and lines and the scenario described above is diagrammed below.
A Discussion Graph
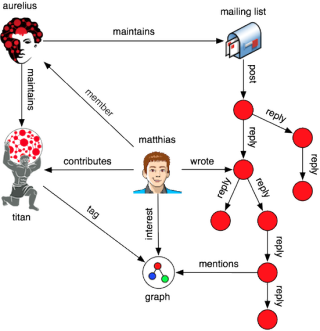
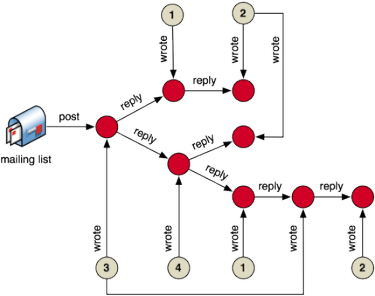
Matthias is interested in graphs. He is the CTO of Aurelius and the project lead for the graph database Titan. Aurelius has a mailing list. On this mailing list, people discuss graph theory and technology. Matthias contributes to a discussion. His contributions beget more contributions. In a recursive manner, the mailing list manifests itself as a tree. Moreover, the unstructured text of the messages make reference to shared concepts.
A Concept Graph
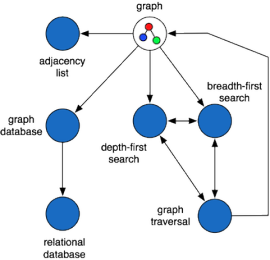
A graph can be used to denote the relationships between arbitrary concepts, even the concepts related to graph. For example, note how concepts (in italics) are related in the sentences to follow. A graph can be represented as an adjacency list. The general way in which graphs are processed are via graph traversals. There are two general types of graph traversals: depth-first and breadth-first. Graphs can be persisted in a software system known as a graph database. Graph databases organize information in a manner different from the relational databases of common software knowledge. In the diagram below, the concepts related to graph are linked to one another demonstrating that concept relationships form a graph.
A Multi-Domain Graph
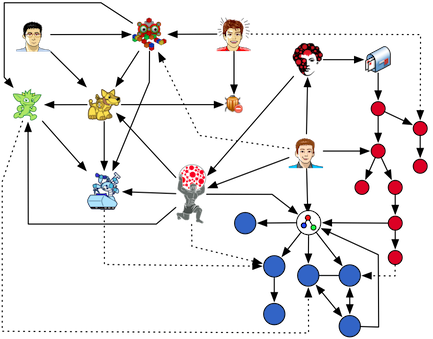
The three previous scenarios (software, discussion, and concept) are representations of real-world systems (e.g. GitHub, Google Groups, and Wikipedia). These seemingly disparate models can be seamlessly integrated into a single atomic graph structure by means of shared vertices. For instance, in the associated diagram, Gremlin is a Titan dependency, Titan is developed by Matthias, and Matthias writes messages on Aurelius’ mailing list (software merges with discussion). Next, Blueprints is a Titan dependency and Titan is tagged graph (software merges with concept). The dotted lines identify other such cross-domain linkages that demonstrate how a universal model is created when vertices are shared across domains. The integrated, universal model can be subjected to processes that provide richer (perhaps, more intelligent) services than what any individual model could provide alone.
Process: Solving Real-World Problems with Traversals
 What has been presented thus far is a single graph model of a set of interrelated domains. A model is only useful if there are processes that can leverage it to solve problems. Much like data needs algorithms, a graph needs a traversal. A traversal is an algorithmic/directed walk over the graph such that paths are determined (called derivations) or information is gleaned (called statistics). Even the human visual system viewing a graph visualization is a traversal engine leveraging saccadic movements to identify patterns. However, as graphs grow large and problems demand precise logic, visualizations and the human’s internal calculator break down. A collection of traversal examples are presented next that solve typical problems in the previously discussed domains.
Determining Circular Dependencies
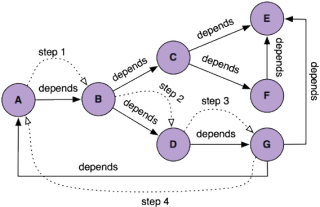
With the growth of open source software and the ease by which modules can be incorporated into projects, circular dependencies abound and can lead to problems in software engineering. A circular dependency occurs when project A depends on project B and, through some dependency path, project B depends on project A. When dependencies are represented graphically, a traversal can easily identify such circularities (e.g. in the diagram below, A->B->D->G->A is a cycle).
Ranking Discussion Contributors
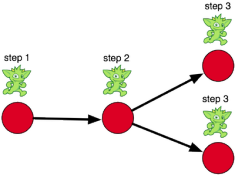
Mailing lists are composed of individuals with varying levels of participation and competence. When a mailing list is focused on learning through discussion, simply writing a message is not necessarily a sign of positive contribution. If an author’s messages spawn replies, then it can be interpreted that the author is contributing discussion-worthy material. However, if an author’s messages end the conversation, then they may be contributing non-sequiturs or information that is not allowing the discussion to flourish. In the associated diagram, the beige vertices are authors and their respective number is a unique author id.
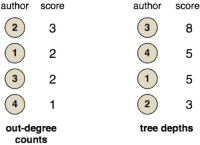 One way to rank contributors on a mailing list is to count the number of messages they have posted (the author’s out-degree to messages in the mailing list). However, if the ranking must account for fruitful contributions, then authors can be ranked by the depth of the discussion their messages spawn (the tree depth of the author’s messages). Finally, note that other techniques such as sentiment and concept analysis can be included in order to understand the itention and meaning of a message.
Finding Related Concepts
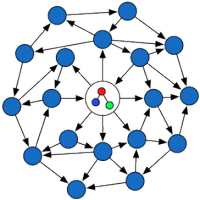 Stephen’s understanding of graphs was developed while working on TinkerPop’s graph technology stack. Nowadays he is interested in learning more about the theoretical aspects of graphs. Via his web browser, he visits the graph Wikipedia page. In a manual fashion, Stephen clicks links and reads articles — depth-first, graph traversals, adjacency lists, etc. He realizes that pages reference each other and that some concepts are more related to others due to Wikipedia’s link structure. The manual process of walking links can be automated using a graph traversal. Instead of clicking, a traversal can start at the graph vertex, emanate outwards, and report which concepts have been touched the most. The concept that has seen the most flow, is a concept that has many ties (i.e. paths) to graph (see priors algorithms). With such a traversal, Stephen can be provided a ranked list of graph related concepts. This traversal is analogous to a wave diffusing over a body of water — albeit real-world graph topologies are rarely as simple as a two-dimensional plane (see lattice).
A Multi-Domain Traversal
The different graph models discussed previously (i.e. software, discussion, and concept) were integrated into a single world model via shared vertices. Analogously, the aforementioned graph traversals can be composed to yield a solution to a cross-domain problem. For example:
“Recommend me projects to participate in that maintain a proper dependency structure, have engaging contributors promoting the space, and are conceptually related to technologies I’ve worked on previously.”
This type of problem solving is possible when a heterogenous network of things is linked together and effectively moved within. The means of linking and moving is the graph and the traversal, respectively. To conclude this section, other useful traversal examples are provided.
“Compute a ‘stability rank’ for a project based on the number of issues it has and the number of issues its dependencies have, so forth and so on in a recursive manner.”
“Cluster projects according to shared (or similar) concepts between them.”
“Recommend a team of developers for an upcoming project that will use X dependencies and is related to Y concepts.”
“Rank issues by the number of projects that each issue’s submitter has contributed to.”
Graph Computing Technologies
The practice of computing is about riding the fine line between two entangled quantities: space and time. In the world of graph computing, the same tradeoffs exist. This section will discuss various graph technologies in order to identify what is gained and sacrificed with each choice. Moreover, a few example technologies are presented. Note that many more technologies exist and the mentioned examples are by no means exhaustive.
In-Memory Graph Toolkits
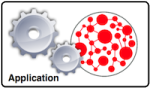 In-memory graph toolkits are single-user systems that are oriented towards graph analysis and visualization. They usually provide implementations of the numerous graph algorithms defined in the graph theory and network science literature (see Wikipedia’s list of graph algorithms). The limiting factor of these tools is that they can only operate on graphs that can be stored in local, main memory. While this can be large (millions of edges), it is not always sufficient. If the source graph data set is too large to fit into main memory, then subsets are typically isolated and processed using such in-memory graph toolkits.
Examples: JUNG, NetworkX, iGraph, Fulgora (coming soon)
- [+] Rich graph algorithm libraries
- [+] Rich graph visualization libraries
- [+] Different memory representations for different space/time tradeoffs
- [-] Constrained to graphs that can fit into main memory
- [-] Interaction is normally very code heavy
Real-Time Graph Databases
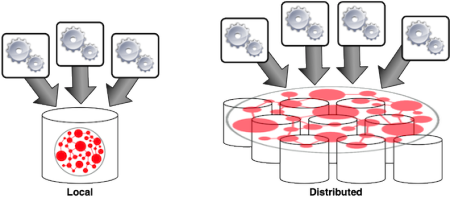
Graph databases are perhaps the most popular incarnation of a graph computing technology. They provide transactional semantics such as ACID (typical of local databases) and eventual consistency (typical of distributed databases). Unlike in-memory graph toolkits, graph databases make use of the disk to persist the graph. On reasonable machines, local graph databases can support a couple billion edges while distributed systems can handle hundreds of billions of edges. At this scale and with multi-user concurrency, where random access to disk and memory are at play, global graph algorithms are not feasible. What is feasible is local graph algorithms/traversals. Instead of traversing the entire graph, some set of vertices serve as the source (or root) of the traversal.
Examples: Neo4j, OrientDB, InfiniteGraph, DEX, Titan
- [+] Optimized for local neighborhood analyses (“ego-centric” traversals)
- [+] Optimized for handling numerous concurrent users
- [+] Interactions are via graph-oriented query/traversal languages
- [-] Global graph analytics are inefficient due to random disk interactions
- [-] Large computational overhead due to database functionality (e.g. transactional semantics)
Batch Processing Graph Frameworks
Batch processing graph frameworks make use of a compute cluster. Most of the popular frameworks in this space leverage Hadoop for storage (HDFS) and processing (MapReduce). These systems are oriented towards global analytics. That is, computations that touch the entire graph dataset and, in many instances, touch the entire graph many times over (iterative algorithms). Such analyses do not run in real-time. However, because they perform global scans of the data, they can leverage sequential reads from disk (see The Pathology of Big Data). Finally, like the in-memory systems, they are oriented towards the data scientist or, in a production setting, for feeding results back into a real-time graph database.
Examples: Hama, Giraph, GraphLab, Faunus
- [+] Optimized for global graph analytics
- [+] Process graphs represented across a machine cluster
- [+] Leverages sequential access to disk for fast read times
- [-] Does not support multiple concurrent users
- [-] Are not real-time graph computing systems
This section presented different graph computing solutions. It is important to note that there also exists hardware solutions like Convey’s MX Series and Cray’s YARC graph engines. Each of the technologies discussed all share one important theme — they are focused on processing graph data. The tradeoffs of each category are determined by the limits set forth by modern hardware/software and, ultimately, theoretical computer science.
Conclusion
To the adept, graph computing is not only a set of technologies, but a way of thinking about the world in terms of graphs and the processes therein in terms of traversals. As data is becoming more accessible, it is easier to build richer models of the environment. What is becoming more difficult is storing that data in a form that can be conveniently and efficiently processed by different computing systems. There are many situations in which graphs are a natural foundation for modeling. When a model is a graph, then the numerous graph computing technologies can be applied to it.
Acknowledgement
Mike Loukides of O’Reilly was kind enough to review multiple versions of this article and in doing so, made the article all the better.
| Reference: | On Graph Computing from our JCG partner Marko Rodriguez at the Marko A. Rodriguez’s blog blog. |

The first Java Project I ever worked on forced me to create a Graph Data Structure in Java 1.1. It was for a company that did pipe system manufacturing. The program was previously written in Visual Basic, C/C++ and RPG and ran on 3 different systems. Since there were no Data Structure packages back in “the day”, I created a Cyclic Graph Data Structure that used Java AWT events to propagate changes through the data structure. Translating 3D coordinates into nodes in a large Chemical Plant Pipe Structure was a blast and you could use events to watch the fluid… Read more »
Very interestng article, I just wanted to note that DEX graph database is now called Sparksee. If you want more information about Sparksee visit http://sparsity-technologies.com
Thank you!