This post is covering one of the Java built-in concepts called Finalizer. This concept is actually both well-hidden and well-known, depending whether you have bothered to take a look at the java.lang.Object class thoroughly enough. Right in the java.lang.Object itself, there is a method called finalize(). The implementation of the method is empty, but both the power and dangers lie on the JVM internal behaviour based upon the presence of such method.
When JVM detects that class has a finalize() method, magic starts to happen. So, lets go forward and create a class with a non-trivial finalize() method so we can see how differently JVM is handling objects in this case. For this, lets start by constructing an example program:
Example of Finalizable class
import java.util.concurrent.atomic.AtomicInteger;

class Finalizable {
	static AtomicInteger aliveCount = new AtomicInteger(0);

	Finalizable() {
		aliveCount.incrementAndGet();
	}

	@Override
	protected void finalize() throws Throwable {
		Finalizable.aliveCount.decrementAndGet();
	}

	public static void main(String args[]) {
		for (int i = 0;; i++) {
			Finalizable f = new Finalizable();
			if ((i % 100_000) == 0) {
				System.out.format("After creating %d objects, %d are still alive.%n", new Object[] {i, Finalizable.aliveCount.get() });
			}
		}
	}
}
The example is creating new objects in an unterminated loop. These objects use static aliveCount variable to keep track how many instances have already been created. Whenever a new instance is created, the counter is incremented and whenever the finalize() is called after GC, the counter value is reduced.
So what would you expect from such a simple code snippet? As the newly created objects are not referenced from anywhere, they should be immediately eligible for GC. So you might expect the code to run forever with the output of the program to be something similar to the following:
After creating 345,000,000 objects, 0 are still alive.
After creating 345,100,000 objects, 0 are still alive.
After creating 345,200,000 objects, 0 are still alive.
After creating 345,300,000 objects, 0 are still alive.
Apparently this is not the case. The reality is completely different, for example in my Mac OS X on JDK 1.7.0_51, I see the program failing with java.lang.OutOfMemoryError: GC overhead limitt exceeded just about after ~1.2M objects have been created:
After creating 900,000 objects, 791,361 are still alive.
After creating 1,000,000 objects, 875,624 are still alive.
After creating 1,100,000 objects, 959,024 are still alive.
After creating 1,200,000 objects, 1,040,909 are still alive.
Exception in thread "main" java.lang.OutOfMemoryError: GC overhead limit exceeded
	at java.lang.ref.Finalizer.register(Finalizer.java:90)
	at java.lang.Object.(Object.java:37)
	at eu.plumbr.demo.Finalizable.(Finalizable.java:8)
	at eu.plumbr.demo.Finalizable.main(Finalizable.java:19)
Garbage Colletion behaviour
To understand what is happening, we would need to take a look at our example code during the runtime. For this, lets run our example with -XX:+PrintGCDetails flag turned on:
[GC [PSYoungGen: 16896K->2544K(19456K)] 16896K->16832K(62976K), 0.0857640 secs] [Times: user=0.22 sys=0.02, real=0.09 secs]
[GC [PSYoungGen: 19440K->2560K(19456K)] 33728K->31392K(62976K), 0.0489700 secs] [Times: user=0.14 sys=0.01, real=0.05 secs]
[GC-- [PSYoungGen: 19456K->19456K(19456K)] 48288K->62976K(62976K), 0.0601190 secs] [Times: user=0.16 sys=0.01, real=0.06 secs]
[Full GC [PSYoungGen: 16896K->14845K(19456K)] [ParOldGen: 43182K->43363K(43520K)] 60078K->58209K(62976K) [PSPermGen: 2567K->2567K(21504K)], 0.4954480 secs] [Times: user=1.76 sys=0.01, real=0.50 secs]
[Full GC [PSYoungGen: 16896K->16820K(19456K)] [ParOldGen: 43361K->43361K(43520K)] 60257K->60181K(62976K) [PSPermGen: 2567K->2567K(21504K)], 0.1379550 secs] [Times: user=0.47 sys=0.01, real=0.14 secs]
--- cut for brevity---
[Full GC [PSYoungGen: 16896K->16893K(19456K)] [ParOldGen: 43351K->43351K(43520K)] 60247K->60244K(62976K) [PSPermGen: 2567K->2567K(21504K)], 0.1231240 secs] [Times: user=0.45 sys=0.00, real=0.13 secs]
[Full GCException in thread "main" java.lang.OutOfMemoryError: GC overhead limit exceeded
 [PSYoungGen: 16896K->16866K(19456K)] [ParOldGen: 43351K->43351K(43520K)] 60247K->60218K(62976K) [PSPermGen: 2591K->2591K(21504K)], 0.1301790 secs] [Times: user=0.44 sys=0.00, real=0.13 secs]
	at eu.plumbr.demo.Finalizable.main(Finalizable.java:19)
From the logs we see that after just a few minor GCs cleaning Eden, the JVM turns to a lot more expensive Full GC cycles cleaning tenured and old space. Why so? As nothing is referring our objects, shouldn’t all the instances die young in Eden? What is wrong with our code?
To understand, the reasons for GC behaving as it does, let us do just a minor change to the code and remove the body of the finalize() method. Now the JVM detects that our class does not need to be finalized and changes the behaviour back to “normal”. Looking at the GC logs we would see only cheap minor GCs running forever.
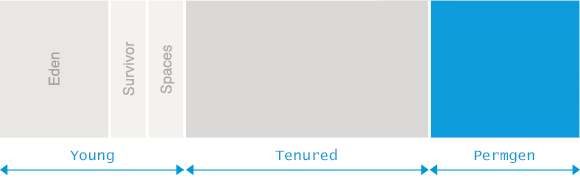
As in this modified example nothing indeed refers to the objects in Eden (where all objects are born), the GC can do a very efficient job and discard the whole Eden at once. So immediately, we have cleansed the whole Eden, and the unterminated loop can continue forever.
In our original example on the other hand, the situation is different. Instead of objects without any references, JVM creates a personal watchdog for each and every one of the Finalizable instances. This watchdog is an instance of Finalizer. And all those instances in turn are referenced by the Finalizer class. So due to this reference chain, the whole gang stays alive.
Now with the Eden full and all objects being referenced, GC has no other alternatives than to copy everything into Survivor space. Or worse, if the free space in Survivor is also limited, then expand to the Tenured space. As you might recall, GC in Tenured space is a completely different beast and is a lot more expensive than “lets throw away everything” approach used to clean Eden.
Finalizer queue
Only after the GC has finished, JVM understands that apart from the Finalizers nothing refers to our instances, so it can mark all Finalizers pointing to those instances to be ready for processing. So the GC internals add all Finalizer objects to a special queue at java.lang.ref.Finalizer.ReferenceQueue.
Only when all this hassle is completed our application threads can proceed with the actual work. One of those threads is now particularly interesting for us – the “Finalizer” daemon thread. You can see this thread in action by taking a thread dump via jstack:
My Precious:~ demo$ jps
1703 Jps
1702 Finalizable
My Precious:~ demo$ jstack 1702

--- cut for brevity ---
"Finalizer" daemon prio=5 tid=0x00007fe33b029000 nid=0x3103 runnable [0x0000000111fd4000]
   java.lang.Thread.State: RUNNABLE
	at java.lang.ref.Finalizer.invokeFinalizeMethod(Native Method)
	at java.lang.ref.Finalizer.runFinalizer(Finalizer.java:101)
	at java.lang.ref.Finalizer.access$100(Finalizer.java:32)
	at java.lang.ref.Finalizer$FinalizerThread.run(Finalizer.java:190)
--- cut for brevity ---
From the above we see the “Finalizer” daemon thread running. “Finalizer” thread is a thread with just a single responsibility. The thread runs an unterminated loop blocked waiting for new instances to appear in java.lang.ref.Finalizer.ReferenceQueue queue. Whenever the “Finalizer” threads detects new objects in the queue, it pops the object, calls the finalize() method and removes the reference from Finalizer class, so the next time the GC runs the Finalizer and the referenced object can now be GCd.
So we have two unterminated loops now running in two different threads. Our main thread is busy creating new objects. Those objects all have their personal watchdogs called Finalizer which are being added to the java.lang.ref.Finalizer.ReferenceQueue by the GC. And the “Finalizer” thread is processing this queue, popping all the instances from this queue and calling the finalize() methods on the instances.
Most of the time you would get away with this. Calling the finalize() method should complete faster than we actually create new instances. So in many cases, the “Finalizer” thread would be able to catch up and empty the queue before the next GC pours more Finalizers into it. In our case, it is apparently not happening.
Why so? The “Finalizer” thread is run at a lower priority than the main thread. In means that it gets less CPU time and is thus not able to catch up with the pace objects are being created. And here we have it – the objects are created faster than the “Finalizer” thread is able to finalize() them, causing all the available heap to be consumed. Result – different flavours of our dear friend java.lang.OutOfMemoryError.
If you still do not believe me, take a heap dump and take a look inside. For example, when our code snipped is launched with -XX:+HeapDumpOnOutOfMemoryError parameter, I see a following picture in Eclipse MAT Dominator Tree:
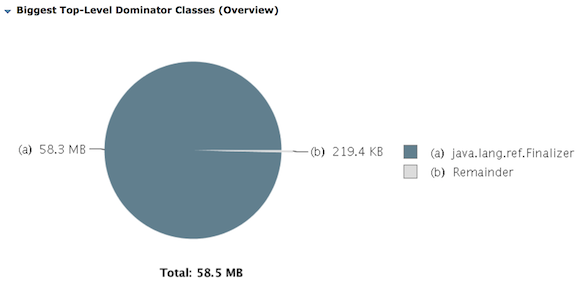
As seen from the screenshot, my 64m heap is completely filled with Finalizers.
Conclusions
So to recap, the lifecycle of Finalizable objects is completely different from the standard behaviour, namely:
- The JVM will create the instance of Finalizable object
- The JVM will create an instance of the java.lang.ref.Finalizer, pointing to our newly created object instance.
- java.lang.ref.Finalizer class holds on to the java.lang.ref.Finalizer instance that was just created. This blocks next minor GC from collecting our objects and is keeping them alive.
- Minor GC is not able to clean the Eden and expands to Survivor and/or Tenured spaces.
- GC detects that the objects are eligible for finalizing and adds those objects to the java.lang.ref.Finalizer.ReferenceQueue
- The queue will be processed by “Finalizer” thread, popping the objects one-by-one and calling their finalize() methods.
- After finalize() is called, the “Finalizer” thread removes the reference from Finalizer class, so during the next GC the objects are eligible to be GCd.
- The “Finalizer” thread competes with our “main” thread, but due to lower priority gets less CPU time and is thus never able to catch up.
- The program exhausts all available resources and throws OutOfMemoryError.
Moral of the story? Next time, when you consider finalize() to be superior to the usual cleanup, teardown or finally blocks, think again. You might be happy with the clean code you produced, but the ever-growing queue of Finalizable objects thrashing your tenured and old generations might indicate the need to reconsider.
| Reference: | Debugging to understand Finalizers from our JCG partner Nikita Salnikov Tarnovski at the Plumbr Blog blog. |
