It’s a well known deficiency of most existing sampling Java profilers that their collection of stack traces has to happen at a safe point. This is the case for profilers such as the sampling profiler, which uses the SUN/Oracle management agent to gather its stack traces. The problem with this approach is that it introduces both a sample bias since not every point in the program is a safepoint and also that it introduces an overhead of how long it takes the JVM to reach a safepoint.
A while back Jeremy Manson open sourced some proof of concept code where calls are made to the AsyncGetCallTrace JVMPI method which avoids the need for threads to reach a safe point in order to read their call trace. Under the hood this code registers a handler function which gets called when a sigprof occurs. Consequently it avoids a number of profiler accuracy issues that other sampling profilers suffer from. The downside of using this method is that the code in your async callback has horrific restrictions on it, for example the inability to heap allocate memory. The proof of concept code showed some great ingenuity but, being a proof of concept, lacked useful features such as a user interface or support for viewing profiling data being updated as the program was running.
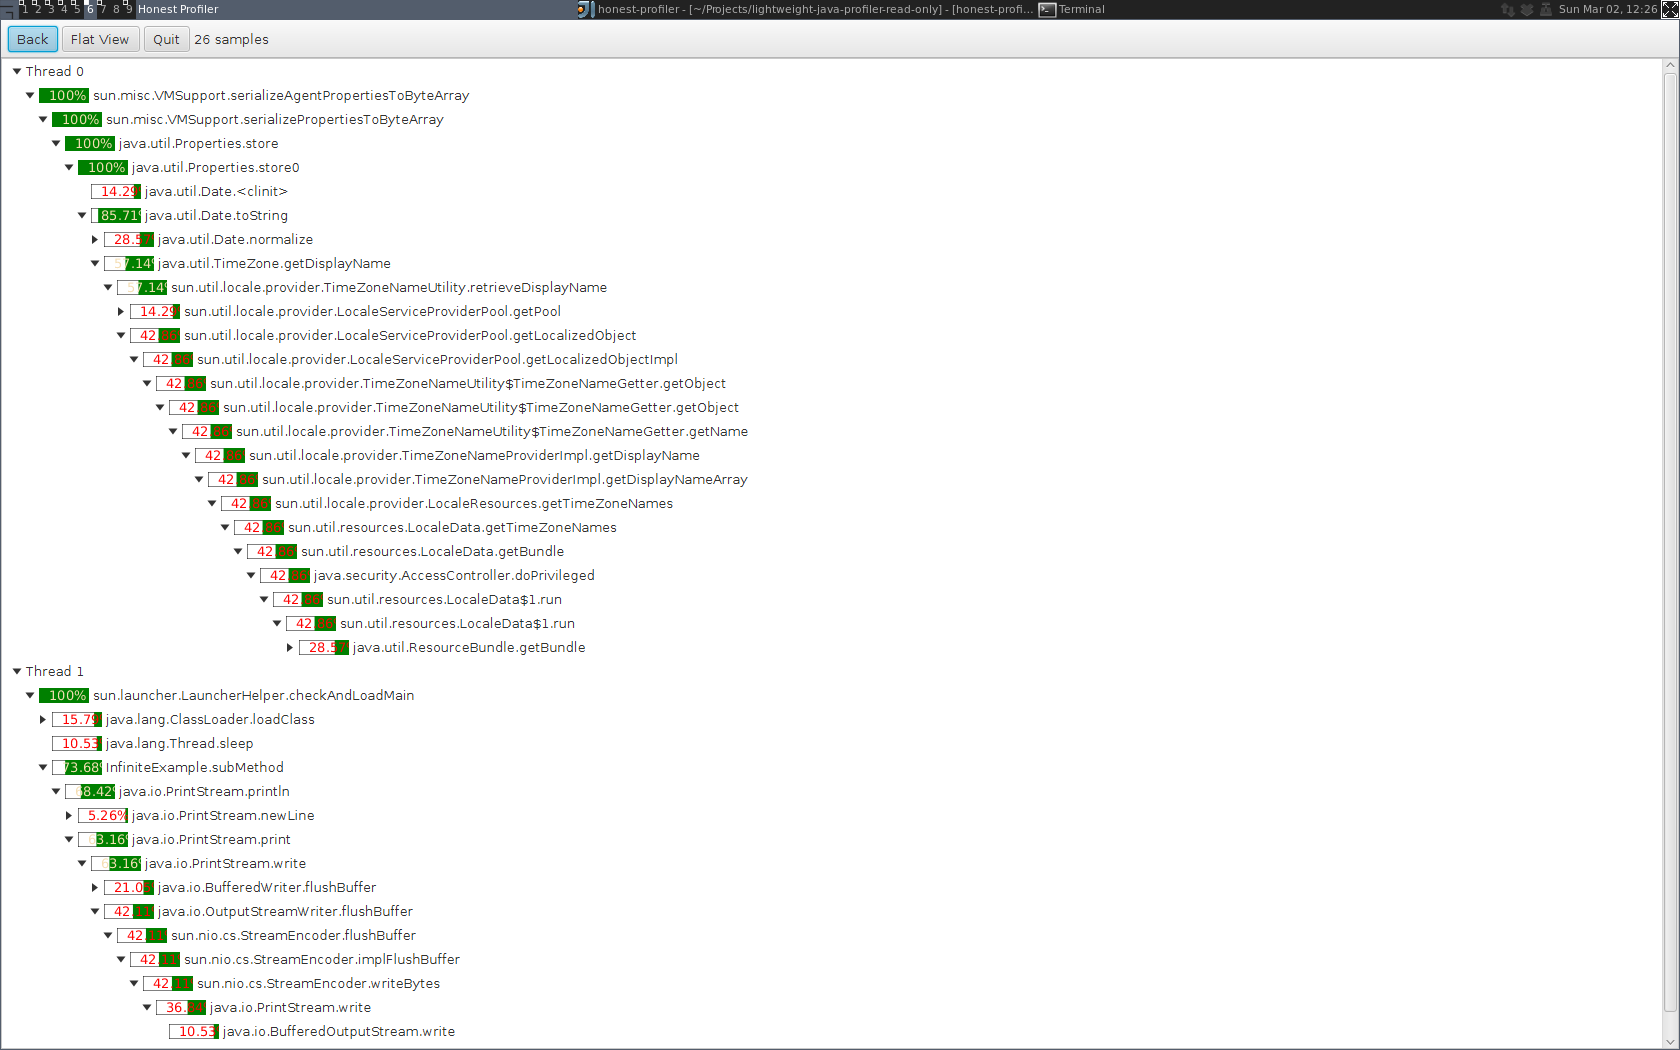
I’ve taken this code dump and started converting it into a usable open source project. The program has two major components. There is a small C++ jvmti agent which writes out a log file describing a profile of the application it has been attached to. Then a Java 8 application can render/display a profile based on this log. The reading and writing code is based upon memory mapped files, so if you were to move the log file to a tmpfs file system it would also work as a shared memory IPC system. I also added a GUI, not a great one – but its a start.
 Generating a log file means that the profile can be analysed offline or retrospectively. For example you can dump out log files from performance testing runs and then look at historical differences if you’ve noticed a regression in production. This profiler gets around the severe restrictions on what can be done in the async callbacks by copying the current stack trace into a non-blocking, multiple producer, single consumer circular queue which allocates a fixed size block of memory up front. These stack traces are then read by another thread which writes out the log file. The other thread also needs to look up information about useful things like method names because the JVMTI calls to lookup method name information aren’t async safe.
At the moment this codebase isn’t production ready – there are a lot of bugs and plenty of C/C++ code that I don’t have complete trust in. Bear in mind that if there’s an error in the JVMTI agent then it might segfault your JVM. You’ve been warned! The source code is on github and is Apache licensed. I would welcome both code contributors and also any feedback that people have. Things are in a pretty early stage at the moment but I’m a big believer that having code out in the open helps rapidly improve its quality.
