In explaining the Agile Demand curve I told a good news story in the previous entry. This time I want to tell a bad news story. This is every classical Project Managers’ fear about Agile, its story we don’t tell often but it can happen. Once I’ve told this story we can proceed to the proper analysis of the Agile Demand curve.
So a classical project manager looks at Agile and he sees his greatest fear: No Scope limit.
There are no signatures against exactly what is to be build, not even in pencil, let alone blood. There are some loose “Story things.” But he is told it is Agile and Agile works this way so against his better judgement he gets stuck in – after all, he needs to get Agile on his CV sometime.
And to some degree the classical Project Manager is right to have this fear.
After years of being pushed around by IT and IT’s sub-contractors the business hears of Agile and thing “Yes! – we are finally going to get what we want. No more messing about with long documents, no longer waiting for ever and no more bugs.”
These days when I go to talk to a company about “going Agile” the Agile publicity machine has beaten me to it. Unfortunately for some on the business side they believe that “going Agile” means they can have whatever they want whenever they want it. If the development team are Agile, so the logic goes, then they will deliver fast and will deliver exactly what is wanted even if the business keeps changing their mind.
You can hardly blame the business side from believing this, after all, it is how Agile presents itself. Unfortunately Agile as “all things to all people” and “I don’t need to change what I’m doing” is more prevalent than is healthy.
The next effect of this attitude is to boost the Demand curve significantly, and if it does affect elasticity it probably reduces it further.
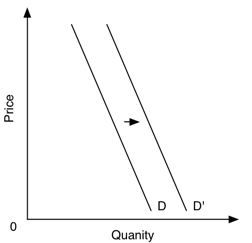
The demand curve moves from D to D’. At every price point the business wants more. Of course the business doesn’t think of it that way. They are just asking for what they always wanted but now, because it is “Agile” they are not restricted.
Previously, the need to put every request in writing – voluminous writing – and argue it with various managers meant making the request required effort (a price) which they were not willing to pay. No with Agile all that is gone and demand is unbounded.
There is one “project” I know which is quite large, we are talking dozens of people all counted. Demand is rampant, the business keeps on thinking of new ideas, analysts keep finding more work in what has been asked for, developers find more work and the testers more (because initial quality is not what it could be.)
In short: I’ve seen rampant demand happen and I think Agile makes it more likely because it removes many of the restrictions previously used to control demand.
If the team don’t deliver on (often unreasonable) expectations “Agile” becomes another tool with which to beat the team.
It is worth noting here: that as demand is derived much of that demand always existed but was hidden. What is a more interesting question to ask is: which elements of this demand are worth doing? That question will need to wait.
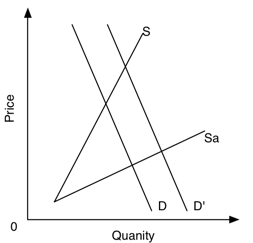
We need to add supply to our diagram above. There are two scenarios we need to consider here and shows in this diagram:
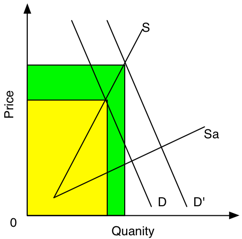
Scenario 1: Demand moves to D’ but the developers are still operating on the original Supply curve S. In which case the amount and the price is going to rise in both dimensions. The next diagram shows this, the yellow area is the pre-Agile cost while green area shows the additional cost.
Scenario 2: Demand moves to D’ again but this time the team are operating on the Sa (Supply Agile) curve. Thus we get this diagram:
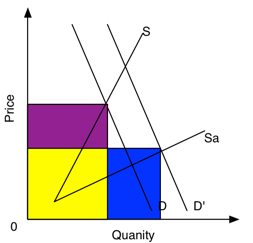
Things are more complex now: because supply is elastic and responds to price more software is produced than at the beginning but the unit price is lower. So the blue are represents increased cost but the purple area represents money saved.
The immediate question I bet you are asking is: have they saved more than they increased?
As it happens yes. On my graphing tool the purpose area takes up 45 grid squares and the blue 46. So they have saved, just.
But, those curves were placed by my for readability without any data for any actual team. The difference is small and demonstrates things could go either way.
A more important question which should be asked is: are the team delivering more benefit? More value?
When I started this blog entry my aim was to show that talking Agile could by itself increase demand. The problem I want to highlight is rampant demand, and this is not confined to Agile. Although I think Agile can make it worse.
What I have also shown is that if the development team really is Agile they can handle this but it isn’t clear.
