This article is about overhead posed by one of the most popular frameworks used – I bet there is close to no applications where the java.util.Collections is not used.
The article is based on the fact that the framework provides default values for e.g. initial size of the collections. So we had a hypothesis that most people do not bother managing the sizes of their collections by themselves, and therefore end up with under-utilised collections wasting memory. If this were so, we could implement a solution that tells people where their half-empty collections are created and what they could do to avoid wasting memory.
Measurements
To test our hypothesis, we decided to measure the usage of thirteen most common java.util.Collection members:
- java.util.HashMap
- java.util.WeakHashMap
- java.util.IdentityHashMap
- java.util.Hashtable
- java.util.LinkedHashMap
- java.util.HashSet
- java.util.LinkedHashSet
- java.util.ArrayList
- java.util.concurrent.ArrayBlockingQueue
- java.util.Vector
- java.util.ArrayDeque
- java.util.PriorityQueue
- java.util.concurrent.ConcurrentHashMap
For all objects deriving from those classes we measured once every 30 seconds the amount of objects contained in the collection and the number of empty spaces in the array(s) underlying the collection. The amount of memory consumed of such empty spaces is a waste of the collection. This data was collected from 556 different real-world applications using a special version of Plumbr.
Results
To estimate of the extent of the problem, we calculated the total waste over all collections after each 30 seconds, and took the maximal and average value of these totals for each session. As also seen from the following diagram, most of the sessions (397 out of 556) had a maximal summary waste of less than a megabyte, and only 32 sessions had a maximal summary waste of over 10 MB, with a maximum of around 60 MB.
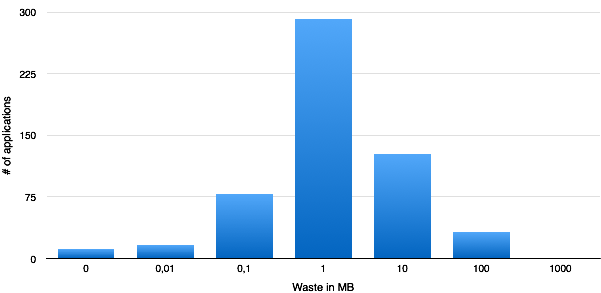
The diagram should be read similar to the following example: there was 291 applications wasting memory more than 0.1MB but less than 1MB.
Conclusions
Comparing the outcome to the heap sizes allocated, we concluded that the problem is not large enough, at least if waste is defined as unused heap. What also made us drop the research in this direction was fragmentation – this waste was often spread over 100′s of different collections, making the optimization harder and more error prone.
The particular research did not go into details whether CPU overhead on dynamically increasing the underlying arrays was a big enough problem, this will be a story for another time.
